The short answer
An AI data center’s power consumption is set by its GPUs, and modern GPUs are power-hungry. One NVIDIA H100 or H200 can draw up to 700 W. An eight-GPU server built around them draws up to 10.2 kW, and its Blackwell successor up to 14.3 kW. A rack of four such servers needs around 40 to 60 kW, and a rack-scale GB200 NVL72 system approximately 120 kW. A campus multiplies those racks by the thousand.
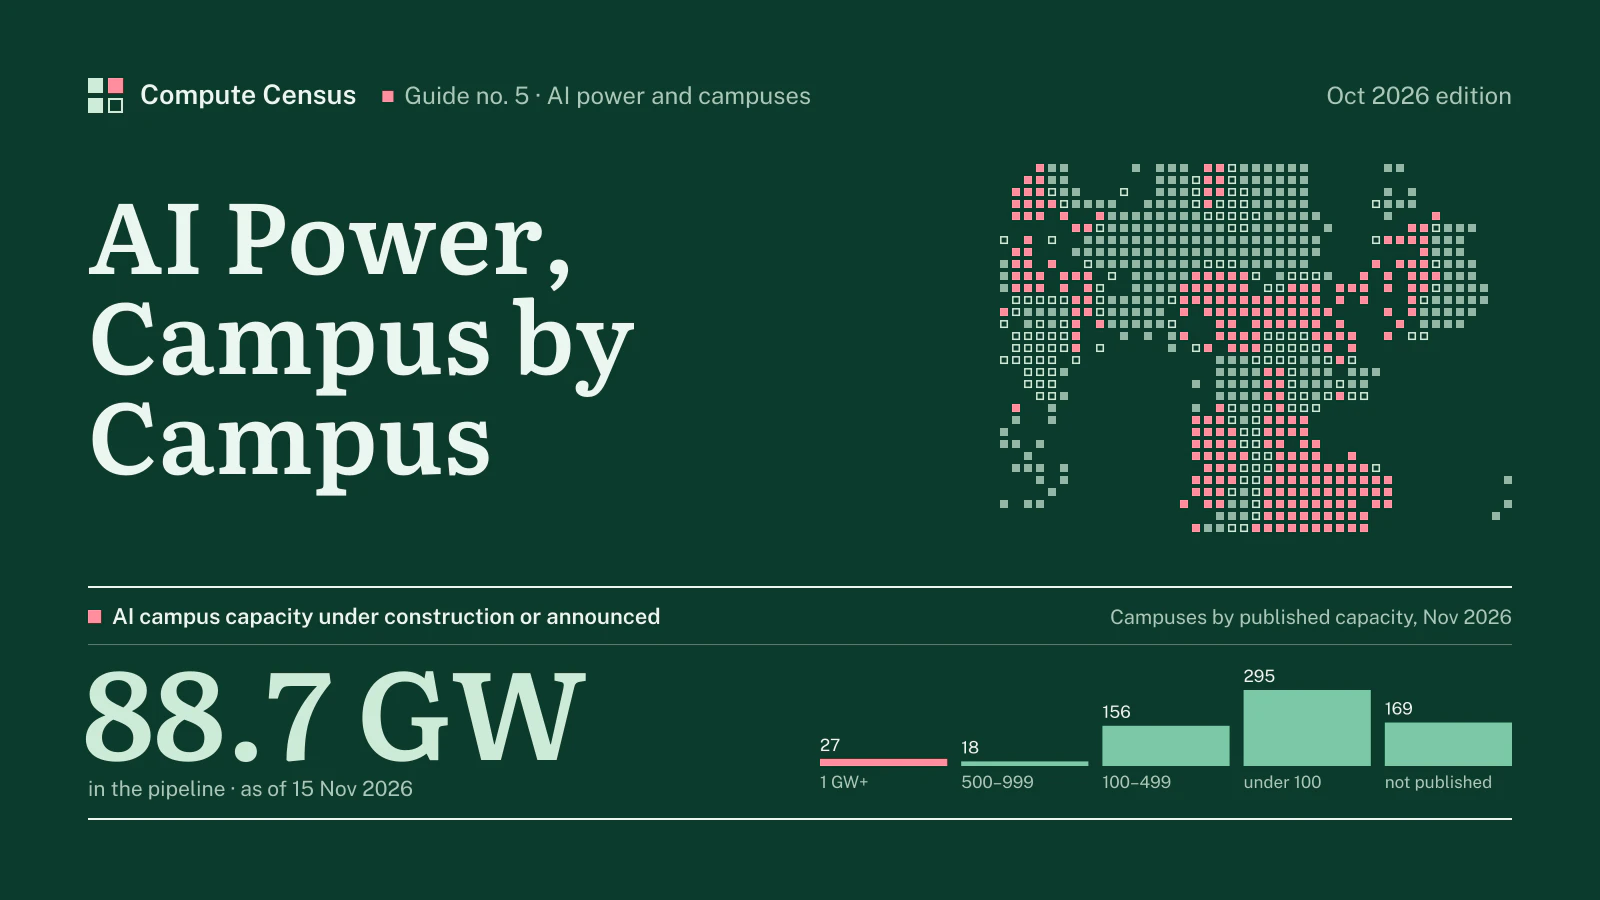
A typical AI-focused data centre consumes as much electricity as 100,000 households, according to the International Energy Agency, and the largest ones under construction will consume 20 times as much. The biggest AI campuses now announce capacities measured in gigawatts. Our census of AI campuses counts 665 of them in 56 countries, with 97.9 GW of published capacity in total and 88.7 GW under construction or announced. 27 individual campuses are rated at a gigawatt or more.
This guide follows the power from the chip to the campus: what each layer draws, how many GPUs a megawatt holds, what our census shows campus by campus, where the electricity comes from, and what all of it means for the price and availability of GPU capacity. It stays with AI campuses and the GPUs inside them; general data center efficiency is a topic of its own.
From one GPU to one server
The chip
The GPU sets the scale. NVIDIA’s specification for the H200 lists a maximum thermal design power of up to 700 W for the SXM module and up to 600 W for the PCIe NVL card, both configurable. The H100 SXM shares the 700 W ceiling. Blackwell parts draw more per GPU, which NVIDIA’s system specifications show at the server level rather than per chip. A GPU does not draw its maximum at every moment, but large training jobs keep GPUs close to full load for days, so planners size power for the ceiling.
Power per GPU has risen with every generation, and so has work per GPU. The two trends pull in opposite directions for a buyer: more watts per chip means denser racks and harder cooling, but fewer chips for the same job. The figure that matters for a campus is total power for a given amount of computing, and that has improved even as each chip has grown hungrier.
The server
A GPU never runs alone. It sits on an eight-GPU baseboard inside a server with CPUs, memory, network adapters, storage and fans, all of which draw power. NVIDIA’s user guides give the maximum power of each generation’s DGX system:
- DGX A100: 6.5 kW maximum.
- DGX H100 and H200: 10.2 kW maximum, from six 3,300 W power supplies.
- DGX B200: approximately 14.3 kW maximum.
Each step adds roughly half again. Divide by eight and the server-level figure per GPU is about 1,275 W for an H100 system and about 1,790 W for a B200 system. SemiAnalysis’s model of a 100,000-GPU H100 cluster uses the same logic, allowing about 575 W of non-GPU server power for every 700 W GPU.
In short, NVIDIA’s user guide gives the DGX H100 a maximum power consumption of 10.2 kW, drawn from six 3,300 W power supplies. Its eight GPUs can each draw up to 700 W; the rest goes to CPUs, memory, network adapters, fans and power conversion.
From one server to one rack
Air-cooled racks
The rack is the unit a data center sells. NVIDIA’s SuperPOD design guide for the H100 recommends four DGX systems per rack, for 40.8 kW per rack, and gives the alternatives: 20.4 kW with two systems, 10.2 kW with one. A scalable unit of 32 systems needs 326.4 kW of server racks however they are arranged, plus management racks for switches and storage. With four DGX B200 systems, the same rack would draw about 57 kW.
For comparison, SemiAnalysis notes that a general-purpose CPU rack supports up to 12 kW. AI racks at 40 kW and above are already several times that, which is why so many existing data centers cannot host AI clusters at full density without new electrical and cooling equipment.
Rack-scale systems
The GB200 NVL72 moved the unit from the server to the rack. It joins 72 Blackwell GPUs and 36 Grace CPUs in one liquid-cooled rack, and SemiAnalysis puts its power need at approximately 120 kW per rack, noting that higher-density H100 air-cooled racks typically support about 40 kW and that moving well past that is the primary reason liquid cooling is required for GB200. A two-rack variant spreads the same GPUs over two racks of about 66 kW each, using about 10 kW more in total for the extra switches and cabling.
The jump from 40 kW to 120 kW per rack is the single biggest change in data center design in a generation. It puts far more power into one rack position than most data halls were designed to deliver. Our census records it in the operators’ own words: where a campus publishes a maximum rack density, the median of those maxima is 100 kW per rack, and 257 campuses record liquid cooling.
The electrical chain behind a rack
Power reaches a GPU through a long chain, and every link has to be sized for the rack’s peak. Electricity arrives from the grid at high voltage, steps down through transformers at the campus substation, passes through switchgear and, in most designs, uninterruptible power supplies that ride through short outages, and is distributed to the halls through busways and power distribution units. Inside the rack, power supplies convert it to the low voltages the servers use. NVIDIA’s DGX GB200 reference design, for example, uses eight power shelves per rack, each able to deliver up to 33 kW, which gives the rack far more supply capacity than its expected draw so that a failed supply or feed does not stop 72 GPUs at once.
Each conversion loses a little energy as heat, and each component has to be duplicated for reliability. That is why a campus’s grid connection is always larger than the sum of its servers, and why the electrical equipment of an AI hall is a large share of its construction cost. When developers quote a campus “capacity”, some are quoting the grid connection at the start of this chain and some the IT load at the end of it.
More work per watt
Rising power per GPU does not mean rising power per unit of work. Each generation does more computation per watt than the last, so a job that needed a room of A100 servers in 2021 needs fewer Hopper servers and fewer still on Blackwell. The power of a campus is therefore a poor proxy for its computing capacity across generations: a megawatt of Blackwell racks does far more than a megawatt of Ampere. When comparing campuses or providers, ask which GPUs the power feeds, not only how much power there is.
For buyers, this has a practical edge. Renting the newest GPUs often costs more per hour but less per finished job, partly because the provider’s power and space costs per unit of work are lower. Our index lets you compare hourly rates; the work per hour comes from your own benchmarks.
Table 4Generations of AI GPUs in the rental index, USD per GPU-hour
| Model | Median | Memory | Providers |
|---|---|---|---|
| A100 | $1.75 | 80 GB | 8 |
| H100 | $3.90 | 80 GB | 11 |
| H200 | $4.80 | 141 GB | 9 |
| B200 | $6.90 | 180 GB | 12 |
| GB200 | $13.25 | 186 GB | 5 |
USD per GPU-hour, on-demand unless stated. Compute Census GPU price index of 6 Nov 2026.
From racks to a campus
How many GPUs fit in a megawatt
A simple conversion links GPUs to megawatts. At about 1,275 W per H100-class GPU at the server, one megawatt of IT load holds roughly 780 GPUs. At about 1,790 W per B200-class GPU, the same megawatt holds about 560. Those figures cover the servers only. Networking switches, storage and management equipment add to the IT load, and cooling and power conversion add on top of that.
The facility overhead is measured as power usage effectiveness, the ratio of total facility power to IT power. The Uptime Institute’s 2026 survey found an industry-wide average of 1.52 and a capacity-weighted average of 1.36, because large facilities run more efficiently. New AI campuses aim lower still. At an overhead of 1.36, a megawatt of grid supply supports about 0.74 MW of IT load, or roughly 575 H100-class GPUs.
As a rule of thumb: roughly 780 H100-class GPUs per megawatt of IT load, if each GPU accounts for about 1,275 W at the server once CPUs, memory and networking are included. Facility overhead reduces the number per megawatt of grid supply.
The cluster scale
SemiAnalysis’s model of a frontier cluster puts the arithmetic at full size. A 100,000-GPU H100 cluster requires more than 150 MW of data center capacity and would consume about 1.59 terawatt hours a year, costing about $123.9 million annually at a standard rate of $0.078 per kWh. That is one training cluster. The largest campuses in our census are planned for several times that.
From campus megawatts to GPUs
The same arithmetic reads the census backwards. A campus announced at one gigawatt, if the figure is critical IT load, could host on the order of half a million Blackwell-class GPUs; if the figure is grid supply, fewer. Developers do not always say which they mean. Some quote IT load, others the utility contract or the approved interconnection, and a few quote generating capacity they build themselves. Two campuses with the same headline figure can therefore host very different numbers of GPUs.
Training and inference draw power differently
The training load
A large training run is the most demanding load a data center has seen. Thousands of GPUs work in lockstep, all near full power for days or weeks, and the cluster’s power draw moves as one. When the job pauses to save a checkpoint or synchronise, the whole cluster’s draw can drop and rise again within seconds. Swings of that kind are a challenge for utilities and for on-site power systems, and battery storage is one way to smooth them: the Colossus sites in Memphis use Tesla Megapacks, according to Cleanview’s survey, alongside grid supply and gas generation.
Training also concentrates power in one place. A frontier run needs its GPUs in one building, or at least one campus, on one network, because the GPUs exchange data constantly. That is what drives the gigawatt campuses: not that any single job needs a gigawatt, but that the largest operators want room for several of the largest clusters side by side.
The inference load
Inference behaves differently. Each request is small, traffic follows users through the day, and the work can be spread across many sites closer to them. An inference fleet’s power draw rises and falls with demand, and it can sit in smaller facilities in more places. As AI products reach more users, inference is becoming a larger share of AI electricity use; the IEA’s projection that accelerated servers will account for almost half of the net increase in data centre consumption covers both.
For grid planners, the difference matters. A training campus is a single very large, steady load; an inference network is many medium loads. For buyers of compute, it matters too: training capacity must be bought in large contiguous blocks, while inference capacity can be assembled from smaller pieces in several places.
Flexible demand
A newer idea is to make AI load flexible: to let a campus reduce its draw when the grid is stressed, in exchange for faster connection. The Georgia approval in our register includes a provision for part of the OpenAI campus’s demand to be flexible. Training jobs that checkpoint regularly can pause; inference cannot easily. How much flexibility AI campuses can really offer is an open question, and the answer will shape how fast grids can connect them.
What the census shows, campus by campus
Capacity by status
Our census counts AI campuses: facility records flagged as AI-ready, or construction and announced projects of at least 50 MW. It sums only the megawatts each campus’s own sources publish. Of 665 campuses, 496 publish a capacity and 169 do not. By status, operational campuses account for 9.1 GW, campuses under construction for 51.1 GW and announced campuses for 37.6 GW.
Table 1AI campuses in the census by status, with published capacity
| Status | Campuses | With published MW | Published MW |
|---|---|---|---|
| Under construction | 259 | 227 | 51,090 |
| Announced | 131 | 111 | 37,645 |
| Operational | 275 | 158 | 9,132 |
Compute Census AI campus census, records to 15 Nov 2026. MW summed only where a source publishes a figure. Full list: AI data center census.
The split is the most important fact in this guide. Most of the AI power the world is talking about does not run yet. It is under construction or announced, and the announced share is the least certain, because it depends on power contracts, permits and financing that are not all secured.
Capacity by size
The census also shows how concentrated the build-out is. A minority of very large campuses carries most of the published capacity: 27 campuses rated at a gigawatt or more account for 41.7 GW between them. The median campus with a published figure is far smaller, at 70 MW.
Table 2AI campuses in the census by published capacity class
| Capacity class | Campuses | With published MW | Published MW |
|---|---|---|---|
| 1 GW or more | 27 | 27 | 41,730 |
| 500–999 MW | 18 | 18 | 11,386 |
| 100–499 MW | 156 | 156 | 33,370 |
| Under 100 MW | 295 | 295 | 11,380 |
| Not published | 169 | 0 | 0 |
Compute Census AI campus census, records to 15 Nov 2026. MW summed only where a source publishes a figure. Full list: AI data center census.
That shape matters for anyone reading headlines. A single gigawatt announcement can add more to a country’s total than dozens of operating colocation sites, and a single cancellation can remove as much. Totals built from announcements move in steps, not curves.
Capacity by country
By country, the United States dominates. The rest of the published capacity is spread across Asia, Europe, the Middle East and Australia, much of it in markets where AI campuses are a recent arrival.
Table 3AI campuses in the census by country, top 10 by published capacity
| Country | Campuses | With published MW | Published MW |
|---|---|---|---|
| United States | 239 | 156 | 54,363 |
| Australia | 31 | 27 | 8,259 |
| India | 55 | 44 | 8,192 |
| Indonesia | 31 | 29 | 4,788 |
| Malaysia | 30 | 25 | 3,935 |
| Japan | 23 | 21 | 2,298 |
| Canada | 19 | 11 | 2,013 |
| Thailand | 19 | 17 | 1,949 |
| United Kingdom | 17 | 13 | 1,837 |
| South Korea | 15 | 13 | 997 |
Compute Census AI campus census, records to 15 Nov 2026. MW summed only where a source publishes a figure. Full list: AI data center census.
The census country pages go into each market in detail; the AI data center census lists every campus, and the India page is a worked example of how announced gigawatts compare with what runs today.
Who is building the gigawatts
The census names the builders. The largest campuses with published figures belong to three groups. Hyperscalers building for themselves include Meta, whose Hyperion campus in Louisiana is the largest single figure in the census, and Google, revealed in 2026 as the owner of a large campus near Cheyenne, Wyoming. AI labs take capacity built by others: OpenAI in Texas, Georgia, New Mexico, Michigan and abroad, Anthropic as anchor tenant of a proposed campus in Queensland and of a campus in Kentucky. Developers and former bitcoin miners — Crusoe, IREN, Galaxy, Aligned, Vantage, STACK, Hut 8, TeraWulf, Nebius — build and lease to whoever signs.
What unites them is the order of operations. Power comes first: a grid connection, a utility contract or a site where generation can be built. Land and buildings follow, and GPUs arrive last. A campus that has secured its power is most of the way to existing; one that has announced megawatts without a power agreement is still an idea.
What the census numbers do and do not say
The census is a register of named campuses and their own published figures. It is not an estimate of the market, and it has three known biases. It undercounts wherever a developer has not disclosed megawatts, which is common among hyperscalers. It overcounts in the sense that announced campuses may never be built, or may be built smaller. And it mixes definitions of capacity, as described above. We print the figures as published and say which campuses publish none, rather than filling gaps with estimates.
Read with those limits, the census is still the most direct view of where AI power is going: which countries, which developers, which sizes, and how much is running against how much is promised.
How AI power compares with the whole grid
Global data center demand
The IEA estimates that data centres used around 415 TWh of electricity in 2024, about 1.5% of world electricity consumption, with the United States accounting for 45%, China 25% and Europe 15%. Consumption has grown by around 12% a year since 2017. In its base case, the IEA projects that data centre electricity consumption will more than double to around 945 TWh by 2030, slightly more than Japan’s total electricity consumption today, with AI the most important driver.
The IEA’s breakdown shows where that growth comes from. Electricity consumption in accelerated servers, mainly driven by AI, is projected to grow by 30% a year, against 9% for conventional servers, and accelerated servers account for almost half of the net increase in data centre consumption. Servers in general account for around 60% of the electricity used in modern data centres. The share of cooling ranges from about 7% in efficient hyperscale data centres to over 30% in less efficient enterprise facilities.
To put the two sources side by side: the IEA estimates that data centres used around 415 TWh in 2024, about 1.5% of world electricity, and projects around 945 TWh by 2030. In the United States, Lawrence Berkeley National Laboratory found that data centers used about 4.4% of electricity in 2023 and could reach 6.7 to 12% by 2028.
The United States
The US picture comes from the Department of Energy’s 2024 report, prepared by Lawrence Berkeley National Laboratory. Data center electricity use climbed from 58 TWh in 2014 to 176 TWh in 2023, and the report estimates 325 to 580 TWh by 2028. The IEA adds that in the United States, data centres account for nearly half of electricity demand growth between now and 2030.
Set against those totals, the census figures are capacities, not consumption, and they describe a pipeline rather than a year. A campus of one gigawatt running at high utilisation all year would use several terawatt hours, so the pipeline in Table 1, if built, represents a large share of the growth both the IEA and the DOE project.
Where the electricity comes from
Utility contracts
Most AI campuses buy power from the grid through contracts with utilities. Those contracts are now negotiated years ahead and at very large scale. Our register of public capacity statements includes a 25-year contract approved by the Georgia Public Service Commission in August 2026 for Georgia Power to supply an OpenAI data center in Effingham County, with part of the demand made flexible, and a long-term power purchase agreement signed with Vistra’s Luminant for the first phase of a Texas campus. Statements like these are kept apart from campus totals in the census, because several describe campuses that are already rows.
The partners behind Stargate described the scale of planning in September 2025, when they said five new US sites together with the Abilene flagship and projects with CoreWeave brought the programme to nearly 7 gigawatts of planned capacity. CoreWeave’s own annual report put its active power at more than 850 MW at the end of 2025, with approximately 3.1 GW contracted for future periods.
On-site and behind-the-meter generation
Where the grid cannot deliver in time, some campuses generate their own power. Cleanview, which tracks behind-the-meter data centers from satellite imagery, describes xAI’s Colossus campuses in Memphis and Southaven as the first major behind-the-meter data center project: mobile gas generators at the first site while grid connections were built, and gas turbines at a former power plant site supplying the second, which had no utility power as of May 2026. Elsewhere in our register, DayOne signed a memorandum with TNB’s generation arm in Malaysia to explore dedicated on-site generation for a planned campus.
The IEA expects a mix: half of the global growth in data centre demand met by renewables supported by storage and the grid, with natural gas expanding by 175 TWh to meet data centre demand, notably in the United States, and nuclear contributing about the same, notably in China.
Grid constraints and delays
Power is now the main constraint on AI capacity. The IEA estimates that, unless the risks are addressed, around 20% of planned data centre projects could be at risk of delays, and notes that building new transmission lines can take four to eight years in advanced economies. Our register holds a concrete example: in September 2026 Oracle notified a developer that it might defer rent on a New Mexico campus if a delayed gas pipeline held up power.
Why AI campuses move to new places
Power availability, more than electricity price, explains the new geography of AI campuses. The established data center hubs have little spare grid capacity, so developers go where it exists: West Texas and the ERCOT market, Louisiana, Wyoming, Pennsylvania’s former coal-plant sites, western Kentucky, regional Australia and the islands near Singapore. Several of those sites were chosen because they already had high-voltage connections from earlier industrial or mining use. Our census records one such case explicitly: IREN reported energisation of its grid connection at Sweetwater 1 in West Texas in April 2026.
Price still matters at the margin. US industrial customers paid less than commercial ones in July 2026, according to the EIA, and large campuses negotiate their own tariffs. But a cheap tariff for power that arrives in five years is worth less to an AI developer than an expensive one available next year, which is why so many projects pair a grid contract with on-site generation for the first phase.
Sizing power for your own deployment
The same arithmetic applies to a buyer placing a few servers rather than building a campus. Eight DGX H100 systems, 64 GPUs, draw up to 81.6 kW at full load; eight DGX B200 systems up to about 114 kW. At four systems per rack that is two racks of about 41 kW or 57 kW each, which already rules out many older colocation halls built for 5 to 10 kW per rack.
The facility then needs to supply that load continuously, with redundancy, and remove the heat. Hosting is priced per kilowatt: CBRE’s North America report for the second half of 2025 gives an average asking rate of $195.94 per kW per month for 250 to 500 kW requirements in primary markets, with vacancy at a record low of 1.4%. At that rate, every kilowatt a deployment reserves costs money whether the GPUs are busy or not, so sizing the reservation to the real peak, not the nameplate of every power supply, is worth the effort.
Three numbers settle most of the planning: the peak kilowatts per rack, the number of racks, and the date the power must be live. A hosting provider that can meet all three is rarer than one that can meet two, and the date is the one most often missed. For a buyer who cannot find all three, renting the same GPUs in a provider’s campus moves the power problem to someone who has already solved it.
What power means for GPU prices
Scarce power, scarce GPUs
The price of renting a GPU depends on how many GPUs are installed and running, and that now depends on power more than on chip supply. A GPU that cannot be plugged in earns nothing. When power for new campuses arrives late, new GPU capacity arrives late, and existing GPUs stay in demand longer than expected. Our index shows this in the H100, whose median stands at $3.90 per GPU-hour, +100% against a year earlier.
Figure 1H100: median on-demand rental price and published range, USD per GPU-hour, 2023-06-01 to 2026-11-06
What electricity costs per GPU-hour
Electricity itself is a small part of the rental price. The US Energy Information Administration reports average prices for July 2026 of 14.53 cents per kWh for commercial customers and 9.77 cents for industrial ones. At about 1,275 W per H100-class GPU, a facility overhead of 1.36 and the industrial price, one GPU costs about 17 cents an hour in electricity while it runs. That is a small fraction of the $3.90 median rental. The cost of power is not the problem; the availability of power is.
Reading a provider’s power story
For a buyer of GPU capacity, the useful question is not how much power a provider’s campus will one day have, but how much is contracted and energised for the capacity being sold. A provider that can show its power in place, or a utility contract with dates, is a safer counterparty for a long-term contract than one whose capacity depends on an announced gigawatt. The same applies to price. A provider whose campus is still waiting for power has every reason to sell future capacity cheaply today and every reason to renegotiate if the power is late; a provider whose halls are energised and full has less room to discount but more certainty to offer. Neither is wrong, but the buyer should know which one it is dealing with before comparing hourly rates.
Questions to ask
- Is the campus energised today, and for how many megawatts of IT load?
- Is the power from the grid under a signed contract, from on-site generation, or both?
- What happens to delivery dates if grid or generation projects slip?
- Does the rack density on offer match the systems you need — 40 kW air-cooled or 120 kW liquid-cooled?
We handle both routes. GPU capacity is available for rent in campuses whose power is in place, and hardware for purchase, through different partners, on terms agreed individually for each request. Tell us the GPUs, quantity, location and timing in the form below, and we come back with what is available and on what terms.