The short answer
The H100 is the faster and more expensive card, and the A100 is the cheaper hour. Which one is cheaper for a finished job depends on a single ratio: how much faster the H100 runs your workload, compared with how much more it costs each hour. If the speed-up is larger than the price ratio, the H100 wins on cost as well as on time. If it is smaller, the A100 wins on cost and the H100 wins only on time.
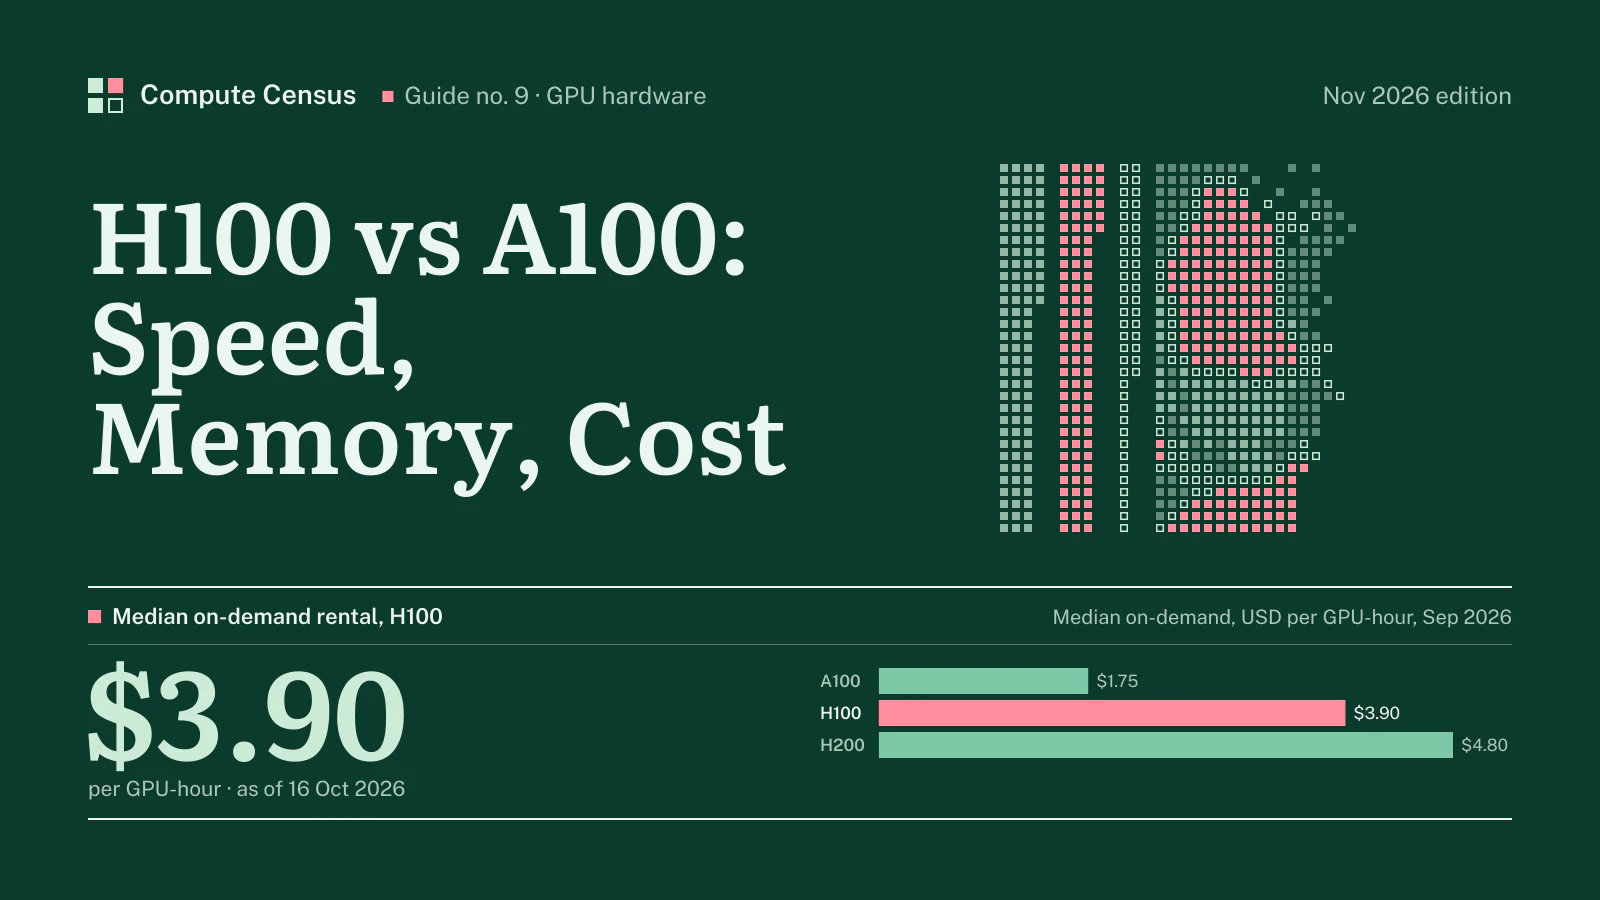
In the Compute Census index of 6 Nov 2026, the median on-demand price of an H100 80GB is $3.90 per GPU-hour. The median for an A100 80GB is $1.75. Those two numbers are the hourly side of the ratio. The other side comes from NVIDIA’s specifications and from benchmarks, and it varies with the job.
NVIDIA says the H100 trains GPT-3 175B models up to four times faster than the prior generation and speeds up inference on the largest models by up to 30 times, and labels both figures as projected. Measured gaps are smaller: NVIDIA’s own TensorRT-LLM tests on GPT-J 6B show 3.0 times the output throughput at a batch of 64 and 2.4 times at a batch of one, with the H100 running FP8 and the A100 running FP16. An independent vendor test of Llama 3.1 70B found about 2.8 times. A fair summary is that the H100 does between about two and about three times the work of an A100 on common language-model jobs, and more where FP8 and very large models are involved.
Set against that, the H100 costs more per hour and a great deal more to buy. The two cards have the same capacity on their flagship versions: 80GB each. So a model that fits on one A100 80GB fits on one H100 80GB, and a model that does not fit on one does not fit on the other.
The rest of this guide takes the comparison apart: the specifications side by side, memory, the benchmarks and their limits, power, the rental index for both cards, the used and server market, and a method to compute cost per job with your own numbers. Every rental figure comes from our own price index and updates when the index does; every external figure is dated and listed on our Sources page.
Two generations side by side
What the datasheets say
The A100 is NVIDIA’s Ampere-generation data center GPU, launched in 2020. The H100 is the Hopper generation that followed it. NVIDIA publishes a specification table for each, and the figures below come from those tables.
| A100 80GB SXM | H100 SXM | |
|---|---|---|
| Memory | 80GB HBM2e | 80GB HBM3 |
| Memory bandwidth | 2,039 GB/s | 3.35 TB/s |
| Maximum power | 400 W (standard) | up to 700 W, configurable |
| FP16 / BF16 Tensor Core, with sparsity | 624 TFLOPS | 1,979 TFLOPS |
| INT8 Tensor Core, with sparsity | 1,248 TOPS | 3,958 TOPS |
| FP8 Tensor Core, with sparsity | not supported | 3,958 TFLOPS |
| FP64 | 9.7 TFLOPS | 34 TFLOPS |
| NVLink bandwidth | 600 GB/s | 900 GB/s |
| PCIe | Gen4, 64 GB/s | Gen5, 128 GB/s |
| Multi-Instance GPU | up to 7 at 10GB | up to 7 at 10GB |
The first thing to notice is that NVIDIA’s headline tensor figures are stated “with sparsity”, a mode in which a structured pattern of zero weights doubles the nominal throughput. Dense throughput is half of each number. Most real workloads run dense, so the fair comparison is 312 TFLOPS against about 990 TFLOPS for 16-bit work, which is a ratio of roughly three. Whichever column you use, the ratio is the same, because sparsity doubles both.
The second thing is that the ratios are not the same on every line. Sixteen-bit tensor throughput is about three times higher on the H100. Memory bandwidth is about 1.6 times higher. NVLink bandwidth is 1.5 times higher. Power is 1.75 times higher at the top of the range. Double-precision throughput is more than three times higher. These ratios matter because different jobs are limited by different lines, and a job’s speed-up lies between the smallest ratio that limits it and the largest one it can exploit.
Where the H100 adds something the A100 cannot do
NVIDIA’s A100 page lists no FP8 mode. The H100 page does, and FP8 is where the headline gains for language models come from. Moving a model from 16-bit to 8-bit arithmetic halves the memory traffic for weights and doubles the arithmetic rate again, which is why the H100’s quoted FP8 figure of 3,958 teraFLOPS with sparsity is about six times the A100’s quoted 624 teraFLOPS at 16 bits. A buyer comparing the two cards on that pair of figures is comparing different precisions, and the difference in what the models actually deliver is smaller.
The H100 also adds a faster link between cards. NVLink runs at 900 GB/s on the H100 SXM and 600 GB/s on the A100, and the PCIe interface doubles from Gen4 to Gen5. Neither matters for a job on one GPU. Both matter for training across eight, because the time spent exchanging gradients between cards is time the arithmetic units sit idle.
The variants within each model
Each card comes in more than one form, and a quote that does not name the form is not comparable.
- A100 80GB PCIe. NVIDIA lists 1,935 GB/s of memory bandwidth and a 300 W maximum, with an NVLink bridge between two cards at 600 GB/s. It fits ordinary servers.
- A100 80GB SXM. 2,039 GB/s of bandwidth and 400 W as the standard configuration, with a custom-cooled HGX version allowing up to 500 W. It needs an HGX baseboard.
- A100 40GB. Half the memory and lower bandwidth, still found in older rental fleets and on the used market.
- H100 SXM. 80GB, 3.35 TB/s, up to 700 W, on an HGX or DGX board.
- H100 NVL. A PCIe card with 94GB of HBM3 at 3.9 TB/s and a 350 to 400 W range, aimed at inference. NVIDIA claims up to five times the Llama 2 70B performance of A100 systems for it.
The rental price in our index refers to the 80GB parts in each case, which is what most providers mean by the plain names. When a listing says “A100” without a size, assume nothing and ask.
Memory decides what fits
Same capacity, different speed
The most common mistake in an H100 versus A100 comparison is to assume the newer card has more memory. It does not. The A100 80GB carries 80GB of HBM2e at 2,039 GB/s on the SXM version, while the H100 SXM carries 80GB of HBM3 at 3.35 TB/s. Capacity is identical on the two flagship cards. The H100’s advantage is bandwidth, about 1.6 times higher, and only the H100 NVL variant adds capacity, with 94GB.
Capacity decides whether a model fits. A model’s weights take a fixed number of bytes per parameter: two at 16-bit precision, one at 8-bit. Seventy billion parameters at 16 bits is 140GB of weights alone, which fits on neither card. It fits on two of either, with room left for the cache that holds each user’s context. At 8 bits, the same model needs 70GB for its weights, which squeezes onto one 80GB card with little left for the cache. The H100 can run that 8-bit model natively and the A100 cannot, because the A100 has no FP8 arithmetic. It can store 8-bit integer weights, but the path is different and the software is less uniform.
Bandwidth decides how fast a model that fits will run when generating text. Producing each new token requires reading the model’s weights from memory, so for small batches the token rate is bounded by bandwidth divided by model size. On that arithmetic alone the H100 should generate about 1.6 times as many tokens per second as the A100. In practice, as the benchmarks below show, it does better, because the H100 also handles larger batches and 8-bit weights.
Price per gigabyte
Since capacity is equal, price per gigabyte of memory is a restatement of the hourly price. Table 1 shows it for both cards, next to the hourly medians and the reserved rates in the index, and adds the H200, the Hopper part with 141GB, for context.
Table 1Ampere and Hopper in the rental index, USD per GPU-hour
| Model | Median | 12-mo reserved | Memory | Median per GB of memory | Floor | Ceiling |
|---|---|---|---|---|---|---|
| A100 | $1.75 | $1.59 | 80 GB | $0.022 | $0.53 | $5.07 |
| H100 | $3.90 | $3.26 | 80 GB | $0.049 | $1.30 | $12.29 |
| H200 | $4.80 | $3.40 | 141 GB | $0.034 | $2.09 | $13.78 |
USD per GPU-hour, on-demand unless stated. Compute Census GPU price index of 6 Nov 2026.
If a job is memory-limited, meaning that you rent a card for its capacity and its speed matters less, then the price per gigabyte and the floor of the A100 are what count, and the A100 is the economical choice. If a job is speed-limited, the capacity is incidental and you should look at cost per job instead, which we come to below. For the H200 and what its extra memory is worth, see our H200 price guide.
How much faster is the H100, really?
What NVIDIA claims
NVIDIA’s H100 page states three headline comparisons with the A100: up to four times faster training on GPT-3 175B, up to 30 times higher inference performance on the largest models, using a 530-billion-parameter chatbot as the example, and up to seven times higher performance on high-performance computing applications such as a 3D fast Fourier transform. The page labels these as projected performance subject to change. All three are best-case numbers on workloads chosen to show the new features: the largest models, FP8 and the fastest interconnect, set against the older card running an older software stack.
Training in the MLPerf benchmark
MLPerf, run by the MLCommons consortium, is the closest thing the industry has to an audited benchmark for training. NVIDIA’s account of the MLPerf Training v3.0 round says the H100 delivered up to 3.1 times more performance per accelerator than NVIDIA’s A100 submission from the previous round, v2.1. That figure compares two rounds, so it includes the software improvements made to the A100 and H100 stacks in between, and it is a maximum over the workloads, not an average.
The same round added a GPT-3 175B test. NVIDIA and CoreWeave trained it on 3,584 H100 GPUs in 10.9 minutes, while 512 H100 GPUs, the smallest submission, took 64.3 minutes. The post gives no A100 time for the GPT-3 test, so it supports a claim about scaling, which was 89 percent efficiency going from 768 to 3,584 GPUs, not a claim about the ratio between the two cards. We found no same-round, same-workload A100 result on that page, and we do not make one up.
For a buyer, the sensible reading is that for large training jobs the H100 does roughly three times the work per GPU, give or take, and its larger NVLink bandwidth makes it scale better across a node. That is enough to make it the default choice for new training clusters, and it is the reason A100 clusters that were state of the art in 2021 and 2022 are now mostly used for other work.
Inference: three independent readings
Inference results depend on the model, the batch size, the precision and the software, so we give three, each with its conditions.
- NVIDIA’s TensorRT-LLM, GPT-J 6B, 128 tokens in and out, one GPU. At a batch of 64, the H100 on FP8 produced 10,907 output tokens per second against 3,679 for the A100 on FP16, a ratio of 3.0, with a first-token latency of 102 milliseconds against 481. At a batch of one, the H100 produced 185 tokens per second against 111, a ratio of 2.4. The page headlines “up to 4.6x” throughput and 4.4 times faster first-token latency, but its own table shows lower figures, and the page does not say which configuration produced the larger ones. We use the table.
- Hyperstack, Llama 3.1 70B, vLLM, a batch of 64. The H100 SXM5 produced 3,311 tokens per second against 1,148 for the A100 NVLink, about 2.8 times. This is a cloud vendor’s own test, with one model and one batch setting.
- The pure bandwidth argument. For small-batch generation, the ratio of memory bandwidths, about 1.6, is a floor on what a well-tuned H100 should deliver.
The first two tests give ratios from 2.4 to 3.0, and the first shows that most of the gain survives at a batch of one, where the card is waiting on memory. That is a useful result: it means the H100 helps even for an interactive service with few concurrent users. It is also, in the first test, partly a precision effect. The H100 ran 8-bit arithmetic and the A100 16-bit, so some of the ratio belongs to the software choice and not the silicon. A team that is not willing to run its models at 8 bits should expect a smaller gain, nearer the bandwidth ratio at small batches and nearer the sixteen-bit tensor ratio at large ones.
What the benchmarks do not tell you
Three cautions apply to every ratio above. First, the vendors publish what flatters them. NVIDIA’s results use its own software at its best settings, and a cloud vendor’s tests show its own hardware. Second, benchmarks run at a fixed model size, while your job has its own. A model that is small relative to the card leaves the H100’s arithmetic units idle just as it does the A100’s, and the ratio collapses toward the bandwidth ratio or below. Third, the benchmarks measure a single GPU or a well-tuned cluster, while real deployments lose time to data loading, checkpointing and failures. The right habit is to run a day’s trial of your own job on both cards and measure the throughput directly. The cost of that trial is small next to the cost of a year of the wrong choice.
What each card costs to rent
The hourly index
Our index records 15 H100 price points from 11 providers and 10 A100 price points from 8 providers. For the H100, the cheapest on-demand offer is $1.30 and the most expensive list price $12.29. For the A100, the floor is $0.53 and the ceiling $5.07. Tables 2 and 3 list the individual quotes. Our methodology page explains what counts as a quote and why spot and preemptible offers are left out of the headline figures.
Table 2H100 prices by provider, USD per GPU-hour
| Provider | Offer | USD / GPU-hr | As of |
|---|---|---|---|
| Lium.io | Marketplace | $1.30 | 2026-09-21 |
| Beam | On-demand | $1.83 | 2026-10-20 |
| CoreWeave | Spot | $2.46 | 2026-10-20 |
| Runpod | On-demand | $2.69 | 2026-10-16 |
| Civo | Reserved, 12 mo | $2.69 | 2026-10-20 |
| Civo | On-demand | $2.99 | 2026-10-20 |
| DigitalOcean | Reserved, 12 mo | $3.26 | 2026-09-28 |
| Runpod | On-demand | $3.99 | 2026-10-16 |
| Lambda | On-demand | $3.99–$4.29 | 2026-10-16 |
| DigitalOcean | On-demand | $4.41 | 2026-10-20 |
| Nebius | On-demand | $4.50 | 2026-10-16 |
| CoreWeave | On-demand | $6.16 | 2026-10-20 |
| AWS | On-demand | ~$6.88 | 2026-10-16 |
| Google Cloud | On-demand | ~$11.00 | 2026-10-16 |
| Microsoft Azure | On-demand | $12.29 | 2026-10-16 |
Price points recorded by the Compute Census index for the H100; third-party index rows are context, not providers. Full table: H100 rental price.
Table 3A100 prices by provider, USD per GPU-hour
| Provider | Offer | USD / GPU-hr | As of |
|---|---|---|---|
| Vast.ai | Marketplace | ~$0.53 | 2026-09-25 |
| Thunder Compute | On-demand | $1.09 | 2026-09-25 |
| Beam | On-demand | $1.36 | 2026-10-20 |
| Civo | Reserved, 36 mo | $1.39 | 2026-09-25 |
| Civo | Reserved, 12 mo | $1.59 | 2026-09-25 |
| GetDeploying median | Third-party index | ~$1.75 | 2026-09-25 |
| Civo | On-demand | $1.79 | 2026-09-25 |
| Runpod | On-demand | $1.79 | 2026-10-20 |
| CoreWeave | On-demand | $2.21 | 2026-09-25 |
| Lambda | On-demand | $2.79 | 2026-10-20 |
| Google Cloud | On-demand | ~$5.07 | 2026-09-25 |
Price points recorded by the Compute Census index for the A100; third-party index rows are context, not providers. Full table: A100 rental price.
Two things stand out when the tables are read together. The first is that the ranges of the two cards overlap. The most expensive A100 offers, usually hyperscaler list prices, can cost more per hour than the cheapest H100 offers on a marketplace. A buyer who compares the A100 at one provider with the H100 at another is comparing providers as much as cards, so the cleanest comparison is within one provider, at the same terms.
How the two prices have moved
The two cards have followed different paths, which is itself information about the market. Figures 1 and 2 show the history of the median for each. For the H100, the median has moved +100% against 1 Oct 2025. For the A100, it has moved not published over the same period, and since our first record, on 1 Jan 2024, it has gone from $3.20 to $1.75.
Figure 1H100: median on-demand rental price and published range, USD per GPU-hour, 2023-06-01 to 2026-11-06
Figure 2A100: median on-demand rental price and published range, USD per GPU-hour, 2024-01-01 to 2026-11-09
The A100 is the older card and its price history is the longer one, while the H100 has had a different path. Our guide on whether the GPU shortage is still on walks through that turn. For this comparison the lesson is practical. The price ratio between the two cards is not a constant of nature. It moves as supply and demand move, and the break-even rule below has to be run with today’s prices, not last year’s.
Hyperscaler cuts
AWS announced in June 2025 that it was cutting On-Demand prices for its H100-based P5 instances by 44 percent and for its A100-based P4d and P4de instances by 33 percent, with effect from 1 June 2025. For Savings Plans, the cuts it listed ran from 25 to 45 percent depending on the plan and term. The percentages are measured from the 31 May 2025 baseline. That the H100 cut was larger than the A100 cut shows where AWS thought the pricing pressure was. The hyperscaler list price is still the top of our range for both cards, so the cuts matter more as a signal than as a price to pay.
On-demand, reserved and the rest
The published 12-month reserved rate for the H100 sits −16% against its on-demand median, and for the A100 −9%. Reserved rates change the ratio: if the H100 earns a larger discount than the A100 for the same commitment, the effective price gap narrows. Reserved figures are fewer than on-demand ones in the index, so treat them as a guide and ask for quotes.
Cost per job: the break-even rule
The formula
Hourly price is not what you pay for. You pay for a finished job: a model trained, a batch of documents processed, a million tokens served. Cost per job is the hourly price multiplied by the hours the job takes. If the H100 finishes the job in a fraction of the A100’s time, its higher rate is spread over fewer hours.
Write the speed-up as S, the number of A100-hours the H100 saves per hour of work, so that a job taking ten hours on an A100 takes ten divided by S hours on an H100. Write the price ratio as R, the H100’s hourly price divided by the A100’s. Then the H100’s cost per job relative to the A100’s is R divided by S. If S is larger than R, the H100 is cheaper per job. If S is smaller, the A100 is. If they are equal, the cost is the same and the H100 still gets the answer sooner.
For R, divide the two medians in Table 1, or better, take the two prices from the provider you plan to use. For S, use a measurement of your own job; failing that, use the ranges below.
A worked example with cited numbers
Hyperstack’s own test gives a clean illustration, with the caveat that it comes from a vendor with an interest in the answer. It measured about 2.8 times the throughput on the H100 and described the H100 as about 1.7 times as expensive, with an H100 SXM price of $2.40 an hour starting point. Hyperstack did not publish an A100 price on that page, so the 1.7 times is its statement and the implied A100 rate of about $1.41 an hour is our inference, not a published figure. On those numbers S is 2.8 and R is 1.7, so the H100 costs about 0.6 of the A100’s amount per token, or roughly 1.6 times as many tokens per dollar.
Now move the numbers. If the H100’s real speed-up on your job is 1.6, the bandwidth ratio and the kind of figure you would see with small batches in 16-bit precision, then the same price ratio of 1.7 makes the A100 slightly cheaper per token. If the speed-up is 3.0, as NVIDIA measured on GPT-J at a batch of 64, the H100 is about 0.57 of the cost. The sign of the answer flips between these cases, which is why we say the A100 is not obsolete and also why a one-line verdict would mislead.
Table 4 turns the rule into a lookup. It uses no price from our index. It shows the H100’s cost per job relative to the A100’s for a range of speed-ups and price ratios, so you can find your own pair.
| Price ratio R (H100 hour ÷ A100 hour) | S = 1.5 | S = 2.0 | S = 2.5 | S = 3.0 |
|---|---|---|---|---|
| 1.5 | 1.00 | 0.75 | 0.60 | 0.50 |
| 2.0 | 1.33 | 1.00 | 0.80 | 0.67 |
| 2.5 | 1.67 | 1.25 | 1.00 | 0.83 |
| 3.0 | 2.00 | 1.50 | 1.20 | 1.00 |
Table 4. H100 cost per finished job as a multiple of the A100’s. Below 1.00 the H100 is cheaper per job. Arithmetic only; no data from our index.
What the table implies
Look along the row for a price ratio of 2.0. At a speed-up of 2.0 the cost is identical, and anything better than 2.0 favours the H100. Look along the row for 3.0 and the H100 needs a three-fold speed-up to merely break even, which it reaches only on its best workloads. If the H100’s price premium widens, the break-even speed-up widens with it.
Reserved contracts and large blocks change R, so recompute with the quote you actually receive. The same rule applies to any pair of GPUs, including the H100 and the H200 or the A100 and the L40S. Only the inputs change.
Time has a price too
The table treats the two cards as interchangeable apart from cost, and they are not. A job that takes 30 hours on an A100 and 12 on an H100 gives the answer a day sooner, and for a team iterating on models, that day compounds. A researcher who runs three experiments a week instead of one learns faster, and the cost of a salary hour usually dwarfs the cost of a GPU hour. The break-even rule therefore understates the case for the H100 for teams whose scarce resource is attention, and overstates it for batch jobs nobody is waiting on.
Buying: used cards, servers and the price gap
Used and refurbished prices
On the secondary market the two cards are far apart. Compute Exchange’s indicative third-quarter 2026 ranges, quoted by IntuitionLabs, are $7,000 to $9,500 for a used A100 80GB, $16,000 to $20,000 for a used H100 PCIe and $22,000 to $27,000 for a used H100 SXM5. These are asking-price ranges, not completed sales. IntuitionLabs is explicit that its figures are seller asks, trade-press numbers and indicative ranges, and that they do not establish a market-wide discount.
On those ranges, a used H100 PCIe costs roughly twice a used A100 80GB, and a used H100 SXM5 about three times. For the A100 40GB, IntuitionLabs cites a refurbished price of around $7,800 and individual used listings far below that, in the range of $2,000 to $4,500. The same review notes that used H100s reportedly traded as high as $50,000 at the mid-2024 peak of scarcity, which is a reminder that these ranges move.
Compare the purchase ratio with the rental ratio. Buyers who expect to keep a card for years pay the price ratio of the purchase, which is larger than the hourly rental ratio at today’s rates. That is one reason the A100 is a better used purchase than it first appears: its price has fallen to a point where it pays back quickly, even though it is slower. For the A100 specifically, see our A100 price guide, and for the H100, our H100 price guide.
The DGX systems
NVIDIA’s own eight-GPU systems show how the cards translate to the server level. When NVIDIA unveiled the DGX A100 on 14 May 2020 it said systems started at $199,000; the system carried eight A100 GPUs with 320GB of GPU memory in total and delivered 5 petaflops of AI performance. The DGX H100 carries eight H100 GPUs with 640GB in total, two Intel Xeon 8480C processors of 56 cores each, two terabytes of system memory and eight ConnectX-7 InfiniBand cards at up to 400 Gb/s each. The A100 system used two AMD EPYC 7742 processors and up to ten ConnectX-6 or ConnectX-7 adapters.
We found no list price for the DGX H100 on NVIDIA’s pages, so we do not quote one here; the H100 price guide covers the street prices that analysts have reported. The point for this comparison is the structure: both are eight-GPU boxes built around an NVLink fabric, and a buyer who moves from one to the other keeps the same rack-level design but changes the power.
Which one to buy used
If your job uses the A100 well, buying a used A100 server and running it for two or three years is a legitimate plan, because the card has been out long enough for its failure modes to be known. If you need FP8, the fastest interconnect or the largest models, buy Hopper. Do not buy an A100 SXM module alone, because it works only on an HGX board.
Whichever you choose, test before you pay: confirm the model and memory size, read the error counters, run a sustained load for several hours, and check that all eight GPUs in a server see each other at full NVLink speed. Negotiate a return window long enough to do it.
Power, cooling and rack density
The per-GPU numbers
The H100 SXM can draw up to 700 W against 400 W for the A100 SXM, and a DGX H100 draws up to 10.2 kW against 6.5 kW for a DGX A100. Per unit of work the H100 can use less energy, but a rack holds fewer H100 systems before it reaches its power limit.
The system figures come from NVIDIA’s user guides. The DGX A100 takes its 6.5 kW from six 3,000 W power supplies, occupies 6U and weighs up to 123.16 kg. The DGX H100 takes 10.2 kW from six 3,300 W supplies, occupies 8U and weighs up to 130.45 kg. Divided by eight, that is about 813 W per A100 at the server and about 1,275 W per H100, including the CPUs, memory, networking and fans. The ratio is roughly 1.57, which is lower than the ratio of the cards’ maximum power because the rest of the server is a fixed cost.
Energy per unit of work
Power is a rate, and a job is a quantity of work, so the right comparison is energy per job. If the H100 does the job two to three times as fast while drawing about 1.6 times as much at the system level, it uses less energy per job: the speed-up divided by the power ratio is above one. That is the main reason the efficiency of GPU fleets improves with each generation, and it is what makes the H100 attractive where power, not hardware cost, is the binding limit.
It does not help a rack. A rack provisioned for a fixed number of kilowatts holds fewer H100 systems than A100 systems, and the higher density per system means more heat to remove from each rack. Halls designed around A100 systems may need new power and cooling to host H100 systems at the same density. NVIDIA’s own SuperPOD design guide for the H100 recommends four DGX H100 systems per rack, which puts the rack at roughly 40.8 kW.
Why this reaches the campus level
Power per rack scales up to power per campus. An operator who replaces A100 systems with H100 systems in the same hall gets more compute for the same floor space but not for the same electrical supply. As of 15 Nov 2026, our census lists 665 AI campuses in 56 countries, with 51.1 GW of published capacity under construction. Table 5 shows how that capacity is distributed.
Table 5AI campuses in the census by published capacity class
| Capacity class | Campuses | With published MW | Published MW |
|---|---|---|---|
| 1 GW or more | 27 | 27 | 41,730 |
| 500–999 MW | 18 | 18 | 11,386 |
| 100–499 MW | 156 | 156 | 33,370 |
| Under 100 MW | 295 | 295 | 11,380 |
| Not published | 169 | 0 | 0 |
Compute Census AI campus census, records to 15 Nov 2026. MW summed only where a source publishes a figure. Full list: AI data center census.
The reason to look at this when choosing between an A100 and an H100 is that the scarce resource in 2026 is often connected power, not GPUs. For a buyer with a fixed power allocation, the figure that counts is useful work per kilowatt. For a renter, it appears indirectly as the provider’s price.
Which one for which job
Large-model training
Choose the H100. The three-fold speed-up in the benchmarks, the faster NVLink and FP8 make it the default. A100 training clusters are still useful for models that are small relative to their memory, but a new cluster should be Hopper or later. If the budget does not stretch to H100 at scale, the better alternative to an A100 cluster is a smaller H100 cluster or a rented block.
Fine-tuning
It depends on the method. Full fine-tuning of a model with tens of billions of parameters is memory- and bandwidth-intensive, and the H100 helps. Parameter-efficient methods on smaller models are often limited by memory capacity, which is equal on the two, and the A100’s lower hourly price can give the lower cost per job. Run the day’s trial.
Inference on mid-sized models
For models up to roughly 13 billion parameters, an A100 80GB holds the weights, the cache and a large batch, and its price per token can be competitive, particularly at high utilisation. For 70-billion-parameter models, one 80GB card is not enough at 16 bits, so the choice is between two cards of either type. The H100’s FP8 support halves the memory the weights need, which can bring a 70B model down to a single card for some uses. That changes the economics by a factor of two before any speed advantage is counted.
Latency-sensitive services
For interactive products, the H100’s lower first-token latency counts for more than its throughput. In NVIDIA’s GPT-J test, first-token latency at a batch of 64 was 102 milliseconds on the H100 against 481 on the A100. A service level objective on response time can force the choice, whatever the cost per token.
Development, testing and batch work
The A100 still makes sense when a job does not use the H100’s extra speed: inference on small and mid-sized models, fine-tuning, development and batch work that is not time-critical. The H100 earns its higher hourly price when a job is bandwidth-bound or large enough to use FP8, because the finished job can cost less even though each hour costs more.
For a team that needs capacity in volume and not speed, a pool of cheap A100s is often the lowest-cost route: marketplace offers set the floor of the A100 index. For a team that needs the answer today, rent Hopper.
A decision in four questions
- Does the model fit on one 80GB card at the precision you will run? If not, you need several cards, and interconnect speed enters the decision.
- Can you run at 8 bits? If yes, the H100’s advantage grows. If not, expect the smaller end of the benchmark ranges.
- Is anyone waiting for the result? If yes, speed has a value beyond the hourly rate.
- What is R today, and is it from one provider at the same terms? Compute R divided by S, with S measured on your own job.
Export rules and availability
Both the A100 and the H100 sit under US export controls on advanced computing items, and the rules have applied differently over time. Buyers outside the United States should ask a seller for the end-user and end-use paperwork before any payment. Availability also differs. The A100 is plentiful on the used market and in rental fleets, while new H100 supply has narrowed as vendors move to later parts. Our H100 price guide covers the vendor end-of-sale notices and the export history in detail, and we do not repeat them here.
How to source A100 and H100 capacity
Decide what you are buying
Start with the job, not the GPU. If the model fits and runs well on an A100, that is the cheaper card. If it needs FP8, the interconnect or the largest batch sizes, it is an H100 job. If it needs more memory than either, look at the H200, which carries 141GB, or at Blackwell. Compare them in our GPU price index before committing, and use the model pages for the H100 and the A100 for the full quote lists.
Questions for a provider of rented capacity
- Is the price for dedicated nodes, shared pools, spot or serverless capacity?
- Which form factor: SXM on an HGX board or PCIe? Which memory size: 40GB or 80GB?
- What is the minimum term, and what are the exit terms?
- Which fabric links the nodes, and is it non-blocking at your cluster size?
- What happens when a node fails: replacement time, credits, spare capacity?
Questions for a seller of hardware
- New, refurbished or used, and with what service history and warranty?
- What exactly is in the server: CPUs, memory, network cards, storage, power supplies?
- What are the lead time, delivery terms and export paperwork for your country?
- Where will it be hosted, and is the power there contracted for the system’s full draw?
We handle both routes. GPU capacity is available for rent and hardware for purchase, through different partners, and the terms are agreed individually for each request: there is no fixed commission and no fixed minimum. Tell us the model, quantity, location and timing in the form below, and we come back with what is available and on what terms.