The short answer
Inference cost is the price of producing tokens: the pieces of text a language model reads and writes. The market quotes it per million tokens, and it comes from two numbers. Divide the hourly price of the GPUs by the number of millions of tokens they produce in an hour. The first number is a price anyone can look up. The second is a measurement that depends on the model, the numeric precision, the length of prompts and answers, and how many requests the server handles at once.
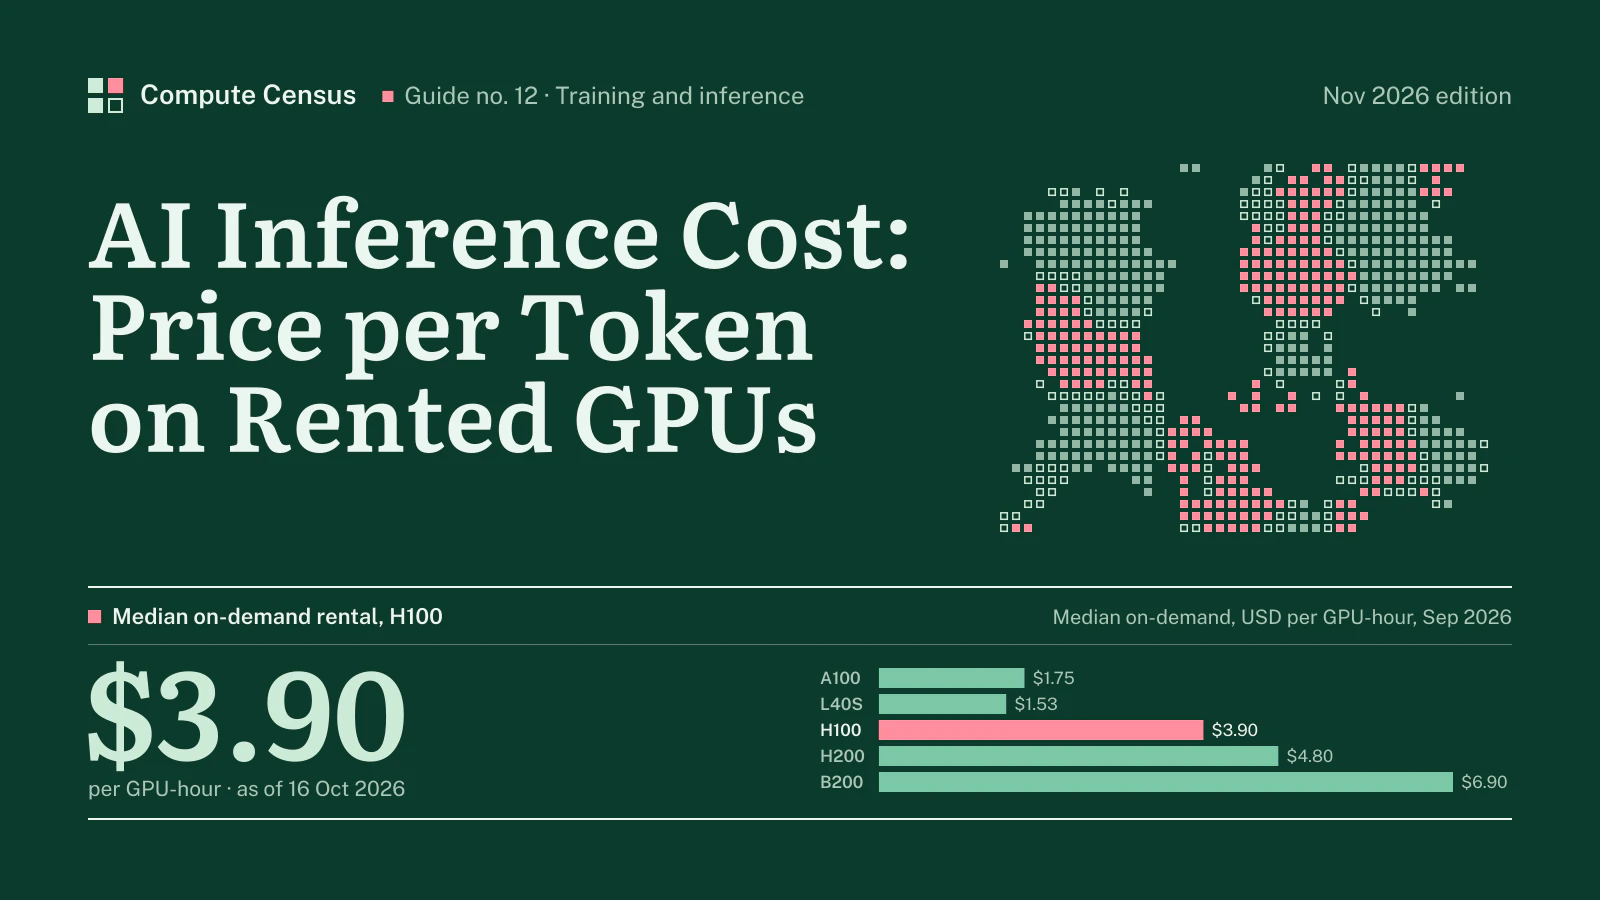
Our index supplies the first number. At the Compute Census snapshot of 6 Nov 2026, the median on-demand price of an H100 80GB is $3.90 per GPU-hour, with a cheapest accepted offer of $1.30 and a highest list price of $12.29. The second number comes from published benchmarks, and we cite them below. NVIDIA’s TensorRT-LLM tables show a single H100 serving a Llama 3.1 8B model at about 15,000 output tokens a second under a balanced load of 1,000 tokens in and 1,000 out. A 70B model needs two H100s and reaches about 4,200 output tokens a second on that pair.
Put those together at a cited rental rate and the results are small numbers. A Llama 3.1 8B model on an H100 at DeepInfra’s published $2.90 per GPU-hour costs about 2.7 cents per million tokens when the GPU is saturated. A 70B model on two H100s costs about 19 cents per million tokens on the same terms. Those are best cases. They assume the card never waits for a request, and real servers do.
Three conclusions follow, and the rest of this guide supports each with numbers. First, model size and prompt shape move the cost per token by more than one hundred times, while the choice between two Hopper GPUs moves it by tens of percent. Second, utilisation is the variable an operator controls, and it decides whether self-hosting beats paying per token. Third, for small and mid-sized open models, pay-per-token prices sit close to the saturated cost of renting the GPUs, so a team that runs its own servers needs steady, heavy traffic to come out ahead.
What counts as a token, and what “cost” covers
Tokens, input and output
A token is a fragment of text, usually a few characters long. A model reads a prompt as input tokens and writes its answer as output tokens, and providers price the two separately because the work differs. OpenAI’s pricing page lists an input rate, a cached-input rate and an output rate for every model, and the output rate is several times the input rate. The same split appears at every provider we looked at, and it is the first thing to check in a quote: a headline “per million tokens” figure that does not say input or output is half a price.
Prefill and decode
Serving has two phases. In prefill the model reads the whole prompt in parallel, which keeps the GPU’s arithmetic units busy and runs fast. In decode it writes the answer one token at a time, and each step must read the model’s weights and its attention cache from memory. Decode is limited by memory bandwidth, not by arithmetic. This is why a card’s memory specification matters for inference as much as its compute rating, and why our price per gigabyte figure below is more than a curiosity.
The vLLM documentation names the metrics a serving benchmark reports. Time to first token measures the wait before the answer starts. Time per output token measures the pace of the answer after that, and inter-token latency measures the gaps between consecutive tokens. Throughput is the total number of tokens per second across all requests. A provider optimises throughput; a user feels time to first token and the pace of the answer. The two pull against each other, and Section “Latency is a cost” below shows by how much.
What a cost per token includes
Three levels of cost are in use, and mixing them is the commonest source of confusion.
- Marginal GPU cost. The hourly rental of the GPUs divided by the tokens they produce. This is the figure we compute in this guide.
- Serving cost. The marginal cost plus the CPUs, networking, storage, load balancing, monitoring and the engineers who keep the service up, plus the idle time between requests.
- Price. What a provider charges, which covers its serving cost, its margin, its free tiers and its research bills.
A cost per token quoted by a chip vendor is almost always the first level at full load. A price quoted by an API provider is the third. The gap between them is real, and it is the subject of the sections on utilisation and on break-even.
From GPU-hour to cost per million tokens
The formula
The arithmetic is short enough to do on paper.
- Take the hourly price per GPU and multiply by the number of GPUs the model needs.
- Take the sustained throughput of that group in tokens per second and multiply by 3,600 to get tokens per hour.
- Divide the hourly cost by the millions of tokens per hour.
A server that costs $5.80 an hour and produces 15 million tokens an hour costs about 39 cents per million tokens. Everything else in this guide is a way of finding honest inputs for that division.
The throughput inputs
The most useful public source of throughput figures is NVIDIA’s own TensorRT-LLM performance overview, which lists the total output throughput in tokens per second for several models, GPUs and prompt shapes. The page was last updated on 15 September 2025 and is built from a specific software build, so it reflects the software of that date and not the faster releases since. The figures are for FP8 precision. For the 70B model they cover two GPUs working together, which is the smallest group that holds the weights and leaves room for the attention cache.
Table 1 reproduces a selection. ISL and OSL are the input and output lengths in tokens. The 8B figures are per GPU. The 70B figures are for a pair of GPUs.
Table 1. Published output throughput, tokens per second (NVIDIA TensorRT-LLM, FP8)
| Model and group | ISL / OSL | H100 | H200 |
|---|---|---|---|
| Llama 3.1 8B, one GPU | 128 / 128 | 26,401 | 27,028 |
| Llama 3.1 8B, one GPU | 1,000 / 1,000 | 14,992 | 17,162 |
| Llama 3.1 8B, one GPU | 2,048 / 128 | 3,276 | 3,391 |
| Llama 3.3 70B, two GPUs | 128 / 128 | 6,092 | 6,328 |
| Llama 3.3 70B, two GPUs | 1,000 / 1,000 | 4,181 | 4,773 |
| Llama 3.3 70B, two GPUs | 2,048 / 128 | 723 | 748 |
| Llama 3.3 70B, two GPUs | 20,000 / 2,000 | 412 | 609 |
Source: NVIDIA TensorRT-LLM performance overview, page updated 15 September 2025.
Read the table by rows, not by columns. The same 8B model on the same H100 produces 26,401 tokens a second on short prompts with short answers and 1,341 on a 20,000-token prompt with a 2,000-token answer. The second job is not slower because the GPU is weaker. It is slower because each request holds a large attention cache in memory, which limits how many requests fit at once, and because long prompts take a long prefill before any answer starts. The tokens-per-second figure is a property of the workload as much as of the card.
One more caution. These are benchmark results from the vendor, produced with a tuned stack at saturation. A team running its own server on a general-purpose engine with real traffic will see less. We treat the figures as an upper bound for cost, which means a lower bound on what a self-hosted token costs.
Where the throughput comes from
Two software facts explain most of the gap between a naive server and a good one. The first is batching: a GPU’s weights are read from memory once per step, and serving many requests in the same step spreads that cost across all of them. The second is memory management. The vLLM paper by Kwon and colleagues, published in September 2023, showed that wasted space in the attention cache limited batch sizes, and reported that vLLM improved throughput by two to four times over earlier systems at the same latency. Every modern serving engine now includes a version of that idea. The practical lesson is that the engine and its settings can move your cost per token by as much as a change of GPU does, and a rental price comparison says nothing about it.
Cost per million tokens at cited GPU-hour prices
Two published price points
Our index records prices across many providers, and we use it below. To keep the first calculation fully traceable, we start with two rates published on provider pages that we opened on 14 November 2026. DeepInfra lists custom deployments of an H100 80GB at $2.90 per GPU-hour. Together AI lists dedicated inference on an HGX H100 at $5.49 per GPU-hour and an HGX H200 at $5.99. Both are on-demand prices. They span much of the range that our index records for H100 capacity, and both belong to providers that sell tokens as well as GPU time, which makes them useful for the break-even later.
The result
Table 2 applies the formula to the 1,000-token-in, 1,000-token-out rows of Table 1. The cost is per million output tokens, and it includes the work of reading the prompt, because the benchmark processes both. Per million tokens of input and output together, divide it by two.
Table 2. Cost per million output tokens at saturation, 1,000 tokens in and 1,000 out
| Model, GPUs and price basis | GPU-hour rate | Cost per hour | Cost per million output tokens |
|---|---|---|---|
| Llama 3.1 8B, 1 × H100, DeepInfra rate | $2.90 | $2.90 | $0.054 |
| Llama 3.1 8B, 1 × H100, Together rate | $5.49 | $5.49 | $0.102 |
| Llama 3.1 8B, 1 × H200, Together rate | $5.99 | $5.99 | $0.097 |
| Llama 3.3 70B, 2 × H100, DeepInfra rate | $2.90 | $5.80 | $0.385 |
| Llama 3.3 70B, 2 × H100, Together rate | $5.49 | $10.98 | $0.729 |
| Llama 3.3 70B, 2 × H200, Together rate | $5.99 | $11.98 | $0.697 |
Calculated by Compute Census from Table 1 and the provider rates named in each row, which we read on 14 November 2026. Saturated throughput, no idle time.
The 70B model costs about seven times as much per token as the 8B model at the same provider’s rate: roughly nine times the parameters, on two cards instead of one. The spread between the two providers’ GPU-hour rates is about two times, which moves the cost per token by the same factor. The hourly rate is a first-order input, and it is the one our index measures.
The H200 result is a small surprise
An H200 costs more per hour than an H100 on Together’s page, yet on the 8B model it comes out slightly cheaper per token, and on the 70B model cheaper by about 4 percent. The larger and faster memory lets it hold more requests at once, so its throughput rises by more than its price. The effect is bigger on long prompts. In the 70B rows of Table 1, the H200’s advantage over the H100 is about 4 percent on the 128 / 128 shape, about 36 percent at 2,048 / 2,048 and about 48 percent at 20,000 / 2,000. Our sibling guide on the H100 and the H200 covers that comparison in full; for inference cost the point is that the GPU with the better price per hour is not always the GPU with the better price per token.
How rental prices in our index enter the formula
The GPU-hour column
Everything above used two published rates. The index lets you do the same with the whole market. Table 3 places the GPUs most often used for inference side by side: the A100, the L40S, the H100, the H200 and the B200, with the memory per card, the price per gigabyte and the cost of keeping one GPU for a month.
Table 3GPUs used for inference in the rental index, USD per GPU-hour
| Model | Median | 12-mo reserved | Memory | Median per GB of memory | Median × 730 h | Floor | Ceiling | Providers |
|---|---|---|---|---|---|---|---|---|
| A100 | $1.75 | $1.59 | 80 GB | $0.022 | $1,278 | $0.53 | $5.07 | 8 |
| L40S | $1.53 | $1.09 | 48 GB | $0.032 | $1,117 | $0.38 | $3.77 | 10 |
| H100 | $3.90 | $3.26 | 80 GB | $0.049 | $2,847 | $1.30 | $12.29 | 11 |
| H200 | $4.80 | $3.40 | 141 GB | $0.034 | $3,504 | $2.09 | $13.78 | 9 |
| B200 | $6.90 | not published | 180 GB | $0.038 | $5,037 | $3.69 | $16.11 | 12 |
USD per GPU-hour, on-demand unless stated. Compute Census GPU price index of 6 Nov 2026.
Two columns deserve attention. The first is the price per gigabyte of memory. A model’s weights must fit in GPU memory, and so must the attention cache for every active request. Llama 3.3 70B has about 70 billion parameters, which is roughly 140 GB in 16-bit form and roughly 70 GB at FP8, according to the model card and the arithmetic of one byte per weight. A single 80 GB card holds those weights at FP8 with almost no room left, which is why NVIDIA’s table uses two GPUs. A card with more memory per dollar lets a team run bigger batches, and bigger batches are cheaper tokens.
The second column is the gap between the floor and the ceiling. At this snapshot, the H100 ceiling sits 9.5× above the floor, and the spread is where an inference operator’s choice of provider shows up. If a 70B model costs 19 cents per million tokens at a $2.90 rate, it costs more than twice that at a rate twice as high, with no change in the model or the code. For steady inference, the hourly price matters more than any engine tweak.
Prices move
Figure 1H100: median on-demand rental price and published range, USD per GPU-hour, 2023-06-01 to 2026-11-06
A cost per token computed today holds for as long as the hourly rate holds. Against 1 Oct 2025, the H100 median has moved +100%. Operators that rent on demand take that change in full. Operators on reserved terms, which at this snapshot stand at $3.26 per GPU-hour for a 12-month H100 commitment, fix the rate for the term and take the risk that the market falls instead. Our guide on renting GPUs explains the contract types.
What API providers charge per token
Published per-token prices
The alternative to renting GPUs is paying a provider per token. Three published price lists show the range, all read on 14 November 2026 and all in US dollars per million tokens.
Table 4. Selected published API prices, USD per million tokens
| Provider and model | Input | Output | Notes |
|---|---|---|---|
| DeepInfra, Llama 3.1 8B Instruct Turbo | $0.02 | $0.04 | open weights |
| DeepInfra, Llama 3.3 70B Instruct Turbo | $0.10 | $0.32 | open weights |
| Together AI, gpt-oss-120B | $0.15 | $0.60 | open weights |
| OpenAI, gpt-6-luna (cheapest of the current list) | $0.10 | $0.50 | batch rate is half |
| OpenAI, gpt-5.4-mini | $0.75 | $4.50 | cached input $0.075 |
| OpenAI, gpt-6.1-terra | $1.00 | $5.00 | cached input $0.05 |
| OpenAI, gpt-5.5 | $5.00 | $30.00 | cached input $0.50 |
Sources: DeepInfra pricing, Together AI pricing and OpenAI API pricing, read on 14 November 2026.
Three features of the table matter for the cost question. Prices for open-weight models served by third parties are low and sit within a small multiple of our saturated GPU costs. Prices for proprietary frontier models are tens of times higher per token, because they buy a different, larger model and not only compute. And every list offers discounts: OpenAI’s batch route is half the standard rate, and its cached-input rates run from a tenth to a half of the input rate. A token is not one price. It is a price that depends on whether the answer must be instant, and whether the prompt has been seen before.
Setting the API price against the GPU cost
Compare the DeepInfra rows with Table 2. For the 70B model, DeepInfra charges $0.10 per million input tokens and $0.32 per million output tokens. On a 1,000-in, 1,000-out mix, the blended price is $0.21 per million tokens in and out together. Our saturated cost on DeepInfra’s own GPU rate is about $0.19 per million tokens on the same mix. The provider’s price is only a few percent above the cost of running its GPUs flat out at the vendor’s throughput.
That tells us two things. The provider is not selling at a large markup over the hardware rate, or it runs a faster stack than the one in the table, or both. And a customer renting the same GPUs to self-host cannot beat that price unless the customer matches the provider’s utilisation and engineering. Section “Self-host or pay per token” turns this into a break-even.
For the 8B model the effect is sharper. DeepInfra’s blended price on the same mix is $0.03 per million tokens, and the saturated cost on an H100 at its own rate is about $0.027. The margin between price and saturated GPU cost is under 12 percent.
Utilisation: the multiplier on every number
Idle hours are billed
Rented GPUs bill by the hour whether or not a request arrives. Every figure in Table 2 assumes a server at its measured saturation throughput for every hour of the month. A real service has a daily rhythm, with a peak in working hours and a trough overnight, and it has to keep headroom for bursts. A serving node at 30 percent of its saturation throughput costs more than three times the benchmark figure per token. At 50 percent, twice.
For the 70B model at the DeepInfra rate, the saturated figure of $0.385 per million output tokens becomes about $0.77 at 50 percent utilisation and about $1.28 at 30 percent. The same node, the same software and the same hourly rate, with a different traffic pattern.
Why saturation is harder than it sounds
A benchmark reaches saturation by sending requests as fast as the server accepts them. A product cannot. Users arrive at random times, and a server that must answer within a time limit cannot queue requests for long. The more strict the latency target, the lower the load a node can carry. Operators handle it in three ways: they spread traffic across more nodes than the average demands, they move non-urgent work to off-peak hours, and they pool many customers on the same fleet. The third is the one an API provider does and a single team cannot.
Latency is a cost
The SemiAnalysis InferenceX project publishes cost per million tokens at fixed levels of interactivity, measured in tokens per second delivered to each user. Its comparison of B200 and H100 on gpt-oss 120B, with 8,000 input and 1,000 output tokens, shows how steeply cost rises with the demanded pace. For the H100, SemiAnalysis lists $0.051 per million tokens at 90 tokens per second per user, $0.078 at 143 and $0.12 at 197. The number of requests the server can handle at once falls from about 32 to about 6 over the same range. The same page prices the H100 at $1.17 per chip-hour and the B200 at $1.73, which are SemiAnalysis’s own estimates of ownership cost at large-hyperscaler volume from its July 2026 survey, not rental prices.
The pattern is the one to remember: faster answers cost more per token, because the server runs smaller batches. A chatbot that streams at reading speed can run on cheap, crowded GPUs. A coding assistant or a voice agent that needs a fast pace pays a multiple for the same model.
Newer GPUs, lower cost per token
What Blackwell changes
The same InferenceX page puts the B200 at $0.013 per million tokens against $0.051 for the H100 at 90 tokens per second per user, and at $0.028 against $0.12 at 197. On those figures the B200 is cheaper per token by about three-quarters at the low end and by more than four times at the fast end, while its chip-hour cost in the same model is only about 48 percent higher. The savings come from throughput, helped by FP4 precision, not from a lower hourly price.
NVIDIA’s TensorRT-LLM tables point the same way. A single B200 running Llama 3.3 70B in FP4 reaches 6,434 output tokens a second on the 1,000 / 1,000 shape, about three times the 2,090 a second per GPU that each H100 contributes in the two-GPU result. The MLPerf Inference v6.1 results that NVIDIA lists for an eight-GPU B200 system show 102,703 tokens a second on the Llama 2 70B benchmark offline and 91,487 on GPT-OSS 120B, which is about 12,800 and 11,400 tokens a second per GPU if throughput divides evenly. That division is our arithmetic, not a figure NVIDIA reports.
What it means in money
Table 5 applies the formula to the B200 at the two cited provider rates, DeepInfra’s $4.89 and Together’s $9.29 per GPU-hour. The TensorRT-LLM row is the 70B model in FP4 on one GPU at 1,000 / 1,000, and the MLPerf row is GPT-OSS 120B at the per-GPU figure derived above.
Table 5. Cost per million output tokens on a rented B200 at saturation
| Workload | DeepInfra rate $4.89 | Together rate $9.29 |
|---|---|---|
| Llama 3.3 70B, FP4, 1 × B200, 1,000 / 1,000 | $0.211 | $0.401 |
| GPT-OSS 120B, MLPerf offline, per GPU | $0.119 | $0.226 |
Calculated by Compute Census from NVIDIA’s published figures and the provider rates read on 14 November 2026. Precision differs from Table 2, so the rows are not a like-for-like model comparison.
Compare the first row with the 70B rows of Table 2. A single B200 at DeepInfra’s rate costs about 21 cents per million output tokens, against 39 cents for two H100s. The B200 stays cheaper per token as long as its hourly rate is below about three times the H100 rate, because one B200 does the work of two H100s at a higher speed. The DeepInfra and Together lists put it at about 1.7 times. The 70B comparison also changes precision from FP8 to FP4, so part of the gain is the number format. In our index, the B200 median and the H100 median are in Table 3, and anyone rerunning the sum with those two numbers can see where the ratio falls at the next snapshot.
One caveat on precision. FP4 trades a small amount of accuracy for speed, and it needs a model prepared for it. A cost advantage that depends on FP4 is a cost advantage only if the quality of the quantised model is acceptable for the task, which is a test the operator must run on its own data.
Self-host or pay per token
The question teams actually ask
The question we meet most often is whether a team can run its own LLM instead of renting tokens. The answer is a break-even in utilisation. Self-hosting has a fixed hourly cost and a ceiling on tokens. The API has a variable cost and no ceiling. The point where they cross is the utilisation at which the node’s cost per token equals the API price.
For small and mid-sized open models, the API usually wins unless the GPUs run close to flat out. Providers sell tokens from clusters that stay busy around the clock, on tuned software, at volumes a single team rarely reaches. A self-hoster has to match that utilisation before the arithmetic turns.
The break-even
Table 6 computes it for the two Llama models, using DeepInfra’s published GPU rate and DeepInfra’s published per-token prices on the same balanced mix of 1,000 tokens in and 1,000 out. It asks what share of the benchmark’s saturated throughput a self-hosted node must sustain to cost the same as buying those tokens through the API.
Table 6. Utilisation at which self-hosting equals the API price (1,000 / 1,000 mix)
| Model | Node and hourly cost | Saturated tokens per hour, in and out | API blended price per million | Break-even utilisation |
|---|---|---|---|---|
| Llama 3.1 8B | 1 × H100, $2.90 | 107.9 million | $0.03 | about 90% |
| Llama 3.3 70B | 2 × H100, $5.80 | 30.1 million | $0.21 | about 92% |
Calculated by Compute Census from Table 1 and DeepInfra’s published rates (14 November 2026). Saturated tokens per hour count input and output tokens, each equal to the output throughput.
A break-even utilisation above 90 percent means that at these prices self-hosting on rented H100s does not beat the API for these two models, in any realistic deployment. The benchmark ceiling is a ceiling, and real servers run below it. We are not claiming that DeepInfra’s prices are the market; we are claiming that where a provider publishes both a GPU-hour rate and per-token prices, the two sit close together, and that an operator should check the same pair at the provider it uses.
When self-hosting still wins
Four situations tip the balance, none of which Table 6 captures.
- A model the API does not offer. A fine-tuned model, a custom adapter or a model with private weights has no per-token price. The comparison is then between renting GPUs and not having the product.
- Data that cannot leave a boundary. A regulated workload or a contract term may rule out sending prompts to a third party at any price.
- A proprietary model’s price as the alternative. Table 4 shows that the frontier models cost tens of times more per token than open-weight ones. A team that can move a task from a frontier model to an open model it serves itself may save much more than the Table 6 margin suggests.
- Steady, predictable, very high volume. A workload that keeps a node busy all day, such as bulk document processing queued for the night, can reach the utilisation the break-even needs. OpenAI’s batch rate at half the standard price is the API’s answer to the same workload, and it should be in the comparison.
For a team with none of the four, the sensible plan is to start on the API, record real token volumes for a quarter and revisit the sum with those figures.
Running several models at low cost
A common version of the question is how to use multiple models without paying for several full-time deployments. The answer is to treat the models by size and urgency, not by name.
Share the GPU between small models. An 8B model in FP8 needs about 8 GB for weights, and the rest of an 80 GB card holds cache. Several small models can share one card or one node, each with its own request queue, as long as the combined cache fits. The cost per model falls in proportion, and the utilisation of the card rises, which is the number that drives the cost per token.
Route by difficulty. Many requests do not need the largest model. A router that sends simple classification, extraction and short answers to a small model, and only hard cases to a large one, cuts the average cost per request by a multiple. The price lists in Table 4 show the size of the prize: the gap between the cheapest and the dearest model on OpenAI’s list alone is more than fifty times on output tokens.
Use the batch and cache routes. Work that can wait hours, such as evaluation runs, embeddings and nightly summaries, can go through a batch API at a lower price. OpenAI lists batch input and output at half the standard rate and cached input at a fraction of the input rate. Prompts that repeat a long shared prefix, such as a system prompt or a document asked about many times, should be structured so the prefix is cached.
Keep the large model on pay-per-token until volume justifies a node. A 70B-class model needs two H100-class GPUs, which at the rates in this guide is a standing hourly bill whether or not it has traffic. Until the volume in tokens per hour approaches the break-even in Table 6, the API is cheaper and carries no idle cost.
Put the four together and the plan for a team with several models is: small models on shared rented GPUs, a router in front, batch routes for non-urgent work, and a pay-per-token API for the large model.
Power: what a token costs in electricity and space
Electricity is a small share of a rented token’s price, because the provider pays it and spreads it over the hourly rate. For anyone who owns the hardware it is a line of its own. NVIDIA’s DGX B200 guide lists eight B200 GPUs, 1,440 GB of combined memory, a maximum draw of 14.3 kW from six 3.3 kW power supplies and a height of 10 rack units. NVIDIA’s DGX H100 guide gives 10.2 kW for eight H100 GPUs. The Blackwell box draws about 40 percent more power. If the throughput per GPU is about three times higher on the 70B model, as in the TensorRT-LLM tables, the energy per token falls by roughly half, before counting the facility’s own overhead.
That is the link to our second series. A rack of DGX B200 systems needs a hall built for it, and the census of AI campuses counts those halls from public records. As of 15 Nov 2026, it lists 665 campuses in 56 countries, and the ones under construction add up to 51.1 GW of published capacity. The median campus that publishes a figure is rated at 70 MW.
Table 7AI campuses in the census by published capacity class
| Capacity class | Campuses | With published MW | Published MW |
|---|---|---|---|
| 1 GW or more | 27 | 27 | 41,730 |
| 500–999 MW | 18 | 18 | 11,386 |
| 100–499 MW | 156 | 156 | 33,370 |
| Under 100 MW | 295 | 295 | 11,380 |
| Not published | 169 | 0 | 0 |
Compute Census AI campus census, records to 15 Nov 2026. MW summed only where a source publishes a figure. Full list: AI data center census.
Inference does not need one giant training cluster, but the same constraint applies to it: capacity that is powered and cooled this year. A rented token’s price reflects that scarcity in the GPU-hour rate, and our index records the rate.
Six mistakes in reading an inference cost
Using a benchmark’s peak as a forecast
Table 1 is a ceiling. A product with variable traffic runs below it. Multiply the cost per token at saturation by the reciprocal of your expected utilisation before comparing it with any API price.
Comparing output tokens with all tokens
Output tokens cost more than input tokens at an API, and a benchmark’s output throughput hides the input work. Say which one a figure counts. A cost per million output tokens on a 1,000 / 1,000 mix is twice the cost per million tokens in and out.
Ignoring prompt length
A 2,048-token prompt with a 128-token answer produced 723 output tokens a second for a 70B model on two H100s, against 4,181 for the balanced mix. Retrieval-augmented products with long prompts and short answers live in the slow rows of Table 1. Test your own shape.
Pricing a model at its parameter count
A mixture-of-experts model activates only a part of its weights for each token, so a model with a large parameter count can serve faster than a dense model of a smaller one. Compare cost per token on measured throughput, never on the number in the model’s name.
Taking an owner’s TCO for a renter’s price
The SemiAnalysis InferenceX prices of $1.17 and $1.73 per chip-hour are large-owner cost estimates. A buyer who rents pays the market rate in our index, which is a different number. Both are valid, and they answer different questions.
Forgetting the quality of the cheaper model
A cost per token compares tokens, not answers. A smaller or more heavily quantised model may need more attempts or fail more tasks. Measure cost per completed task, on your data, before you decide that the cheaper token is the cheaper product.
How to source GPU capacity for inference
Decide the shape of the job first
Write down the model, the precision, the prompt and answer lengths, the pace users need and the peak and average request rate. With those five facts, Tables 1 and 2 give a first estimate of GPUs and cost, and the index tells you what the GPUs cost.
Questions for a provider of rented capacity
- Is the price for a dedicated node, a shared pool, spot capacity or a serverless endpoint?
- What are the minimum term and the exit terms, and can capacity scale down overnight?
- Which GPUs and how much memory per card, and is the interconnect fast enough for a model split across two or four GPUs?
- Which serving engine is supported, and who handles the upgrade when a new engine release improves throughput?
- What happens when a node fails: replacement time, credits, spare capacity?
Questions for a seller of hardware
- Which variant is it, and what memory does each card carry?
- What power does the server draw, and does the host site have that power contracted today?
- What are the lead time, warranty and export paperwork for your country?
We handle both routes. GPU capacity is available for rent and servers for purchase, through different partners, and the terms are agreed individually for each request: there is no fixed commission and no fixed minimum. Tell us the model, the expected request rate, the location and the timing in the form below, and we come back with what is available and on what terms.