The short answer
The H200 is an H100 with more memory. Both are built on NVIDIA’s Hopper design, and NVIDIA’s own specification pages list the same peak arithmetic rates for the two SXM modules. What changes is the memory: 141 GB at 4.8 TB/s on the H200, against 80 GB at 3.35 TB/s on the H100 SXM. That is 1.76 times the capacity and 1.43 times the bandwidth, on a card with the same 700 W power limit.
So the question “is the H200 better?” has a narrow answer. For jobs limited by memory, yes, and sometimes by a lot. For jobs limited by arithmetic, no: the two cards do the same work per second. NVIDIA’s launch figures put the H200 at up to 1.9 times the H100 on one Llama 2 70B test. Independent tests found anything from no gain at all to 3.4 times, depending on how much of the memory the job could use.
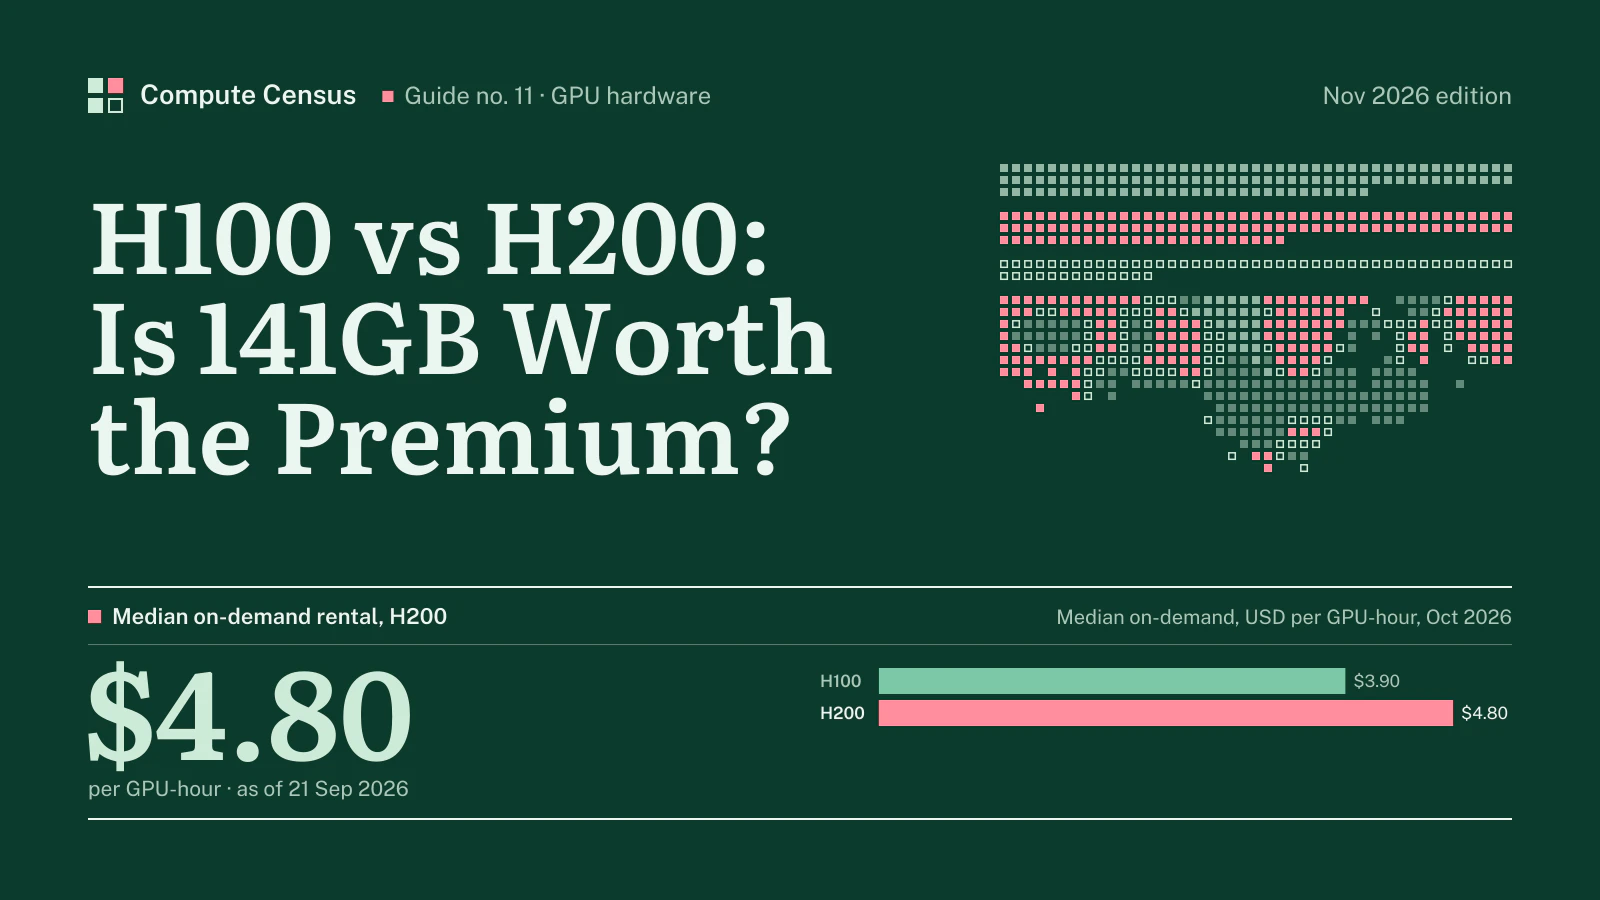
The price side is the second half of the answer. In the Compute Census index of 6 Nov 2026, the median on-demand price of an H200 is $4.80 per GPU-hour, against $3.90 for an H100. The premium pays only if the speed-up on your job is larger than the price ratio, and the later sections give a rule and a lookup table to test that.
This guide goes in the order a buyer decides. First what the datasheets say. Then why memory capacity and memory bandwidth change real throughput, with arithmetic you can repeat. Then what published benchmarks measured, and under which conditions. Then what each part costs to rent, how to turn a speed-up into a cost per job, how the two compare for power and purchase, and which jobs belong on which. Every rental figure comes from our own price index and updates with it. Every external figure is dated and listed on our Sources page. For the full buy-side price picture of each card, see our guides to the H100 and the H200; this one is about choosing between them.
What the specification sheets say
Same engine, different memory
NVIDIA’s pages for the two parts give the arithmetic rates in one shared format, and the numbers for the SXM modules match line for line: 989 TFLOPS for TF32, 1,979 TFLOPS for BF16 and FP16, and 3,958 TFLOPS for FP8 and INT8, all quoted with sparsity. FP64 is 34 TFLOPS on both, or 67 TFLOPS on the tensor cores. The H200 is not a faster processor. It is the same processor attached to a bigger and faster pool of memory.
Table 1 sets out the two SXM modules and the two PCIe-style NVL cards side by side. Every figure comes from NVIDIA’s own pages, which describe the H200 numbers as preliminary and subject to change.
| H100 SXM | H200 SXM | H100 NVL | H200 NVL | |
|---|---|---|---|---|
| GPU memory | 80 GB | 141 GB | 94 GB | 141 GB |
| Memory bandwidth | 3.35 TB/s | 4.8 TB/s | 3.9 TB/s | 4.8 TB/s |
| FP8 tensor (with sparsity) | 3,958 TFLOPS | 3,958 TFLOPS | 3,341 TFLOPS | 3,341 TFLOPS |
| Maximum power | up to 700 W | up to 700 W | 350–400 W | up to 600 W |
| NVLink | 900 GB/s | 900 GB/s | 600 GB/s | 900 GB/s per GPU |
| MIG slices | 7 at 10 GB | 7 at 18 GB | 7 at 12 GB | 7 at 16.5 GB |
Table 1. NVIDIA specifications for the H100 and H200 families. Source: NVIDIA product pages, read 14 November 2026.
Three rows deserve a second look. The memory row shows the SXM gap at 61 GB and the NVL gap at 47 GB, because the H100 NVL was already a larger part than the H100 SXM. The bandwidth row shows a 1.43 times gap for the SXM cards but only about 1.23 times for the NVL cards. And the power row shows that the SXM pair share a ceiling while the NVL pair do not: the H200 NVL is rated up to 600 W against 350 to 400 W for the H100 NVL, a real increase in heat for an air-cooled card.
The NVL cards are a closer match than the SXM modules
The H100 NVL, with 94 GB and 3.9 TB/s, sits much nearer to the H200 NVL than the 80 GB H100 SXM sits to the H200 SXM. NVIDIA’s H200 page claims up to 1.7 times the LLM inference performance and up to 1.3 times the HPC performance of the H100 NVL, against its “up to 1.9 times” for the SXM pair. The page gives no footnote for the NVL comparison, so we treat it as a marketing ceiling and not a tested ratio. The practical lesson is that “H100” on a quote may mean an 80 GB module or a 94 GB card, and the case for upgrading depends on which one you are comparing against.
Systems: one chassis, two memory sizes
At system level the two generations are almost the same machine. NVIDIA’s DGX user guide covers the DGX H100 and DGX H200 together. Both are 8U systems, both draw up to 10.2 kW, and both weigh up to 130.45 kg. The one line that differs is total GPU memory: 640 GB for the H100 system and 1,128 GB for the H200 system. Divided by eight, that is the 80 GB and 141 GB per GPU on the module pages.
For a data center operator that is the useful fact. An H200 cluster needs no more power, rack space or cooling than an H100 cluster of the same GPU count, so the choice does not change the building. It changes only what the GPUs can hold.
Why capacity changes throughput
Weights and the cache
An inference server keeps two things in GPU memory. The first is the model’s weights, which are fixed for a given model and precision. The second is the key-value cache, which holds the attention state of every active request and grows with each token of context. Whatever memory remains after the weights is the budget for the cache, and the cache size decides how many requests the GPU can serve at once.
The arithmetic is simple enough to do on paper. Meta’s Llama 3 paper lists the 70-billion-parameter model with 80 layers, 64 attention heads and a model dimension of 8,192, and says it uses grouped-query attention with 8 key-value heads. The head size is 8,192 divided by 64, or 128. Each token therefore stores a key and a value for 8 heads in each of 80 layers, which is 2 × 80 × 8 × 128 = 163,840 values. At 16-bit precision that is 327,680 bytes, about 0.33 MB, for every token of every active request.
Take the weights at 8-bit precision, which for 70 billion parameters is about 70 GB. Table 2 subtracts them from each memory size. It ignores activations, framework overhead and any safety margin, so it overstates what a real server can hold. The ratio between the rows is more reliable than the absolute counts.
| Setup | GPU memory | Left after 70 GB of weights | Tokens of cache at 0.33 MB each | 4,096-token conversations |
|---|---|---|---|---|
| One H100 | 80 GB | 10 GB | about 30,500 | about 7 |
| One H200 | 141 GB | 71 GB | about 216,700 | about 52 |
| Two H100 | 160 GB | 90 GB | about 274,700 | about 67 |
Table 2. Cache budget for Llama 3.1 70B with 8-bit weights and a 16-bit cache. Our arithmetic from the architecture in Meta’s paper; an upper bound, ignoring runtime overhead.
The single H200 holds about seven times the cache of a single H100, from a card with 1.76 times the memory. The reason is that the weights take a fixed bite out of both. The more of the card the weights consume, the more each extra gigabyte is worth. This is the real mechanism behind the H200’s best results, and it explains why the gains in published tests vary so much: a model that leaves plenty of room on the H100 gains little, and a model that nearly fills it gains a great deal.
The bottom row of Table 2 shows the alternative. Two H100s hold more cache than one H200, at the cost of a second GPU-hour and of the traffic between the two cards. Whether two H100s or one H200 is cheaper per useful token depends on the price of each, which is why the price section below matters as much as the architecture.
What does not fit
At 16-bit weights the same 70-billion-parameter model needs about 140 GB, so it would fill an H200 almost completely and leave nothing for the cache. In practice it must be split across at least two GPUs of either type, or run at 8 bits. This is the first thing to check in any quote: whether the model fits on one card at the precision you intend to run. If it fits on neither, the H200’s advantage disappears. If it fits on the H200 and needs two H100s, the advantage is at its largest.
The dstack benchmark shows the other end of the range. It ran Llama 3.1 405B at 8-bit precision on an eight-H100 server with 640 GB of total memory, and found the H100 server starting to struggle at a batch size of 16 with long prompts, because the cache no longer fitted and the engine had to recompute or offload it. The authors describe the saturation point as the moment when prompt length times batch size exceeds the memory left for the cache. An eight-H200 server has 1,128 GB for the same job, with room for a far larger batch before that point.
Parallelism has a price
NVIDIA’s account of its MLPerf Inference v4.0 entries makes the same point from the other side. The H200’s extra memory, it says, removes the need for tensor or pipeline parallelism for optimal performance on the Llama 2 70B benchmark, which cuts communication between GPUs. Splitting a model across cards costs time in data exchange, and a part that holds the whole model avoids it. Part of every H200 gain on large models is therefore not faster memory at all, but fewer cards cooperating.
Why bandwidth changes throughput
Decoding waits on memory
Generating text one token at a time reads the model’s weights from memory for every step. At small batch sizes the arithmetic units finish quickly and then wait for the next block of weights. That makes decoding memory-bound: its speed follows the memory bandwidth, not the arithmetic rate. The H200’s 4.8 TB/s against the H100’s 3.35 TB/s sets a rough floor of 1.43 times for a well-tuned decoder at a small batch.
The first step of a request, processing the prompt, behaves differently. It is arithmetic-heavy, so it runs at the speed of the compute units, which are identical on both cards. NVIDIA’s TensorRT-LLM documentation says as much: time to first token is compute-bound for most input lengths, so it is similar on the H200 and the H100. A service whose users wait mainly on the first token, such as one with very long prompts and short answers, gets less from the H200 than a service that streams long answers.
Two effects stack
Capacity and bandwidth compound. More cache room lets the server run a larger batch, which raises throughput until the arithmetic units are busy. Higher bandwidth then makes each step of that larger batch run faster. NVIDIA’s launch comparison shows both effects at work, since the H200 results use a larger batch than the H100 ones. That is fair as a statement about what each card can do at its best, and misleading if read as a speed-up at equal settings. The next section lists the conditions of each published figure so that you can tell which kind of comparison you are looking at.
What the benchmarks measured
Four sources, four answers
Published H100 vs H200 results are best read as a set, because each one tests a different regime. Table 3 lists the seven figures we found, with their conditions.
| Source | Model and setup | H200 against H100 |
|---|---|---|
| NVIDIA H200 page | Llama 2 70B, 2,048 tokens in, 128 out, one GPU; H100 at batch 8, H200 at batch 32 | up to 1.9× |
| NVIDIA H200 page | GPT-3 175B, 80 in, 200 out, eight GPUs; H100 at batch 64, H200 at batch 128 | 1.6× |
| NVIDIA, MLPerf Inference v4.0 | Llama 2 70B, both at 700 W | up to 28% better |
| NVIDIA, MLPerf Inference v4.0 | Llama 2 70B, H200 at 1,000 W with custom cooling | 43% (server), 45% (offline) |
| Baseten, 8 GPUs | Mistral Large 123B, 32,784 tokens in, 2,048 out, batch 64, BF16 | 3.4× |
| Baseten, 8 GPUs | Mistral Large 123B, 2,048 in, 2,048 out, 4,096 requests | +47% BF16, +36% FP8 |
| Baseten, 8 GPUs | Mistral Large 123B, 128 in, 2,048 out, batch 64 | about equal BF16, +11% FP8 |
Table 3. Published H200 against H100 inference comparisons and their conditions. Sources: NVIDIA, Baseten; see Sources.
NVIDIA’s own figures
NVIDIA’s launch page headlines “up to 1.9 times” on Llama 2 70B and 1.6 times on GPT-3 175B. Its footnotes show that the two cards were not run at the same batch size: the H100 at 8 and the H200 at 32 in the first test, 64 and 128 in the second. The TensorRT-LLM page that holds the detail says the benchmark used software version 0.5.0 and that later releases improved on it. The figures are preliminary and the page says they may change.
The MLPerf result is the more tightly controlled one, since MLPerf fixes the workload. NVIDIA reports that the H200 delivered up to 28 percent better Llama 2 70B inference performance than the H100 at the same 700 W power limit, and that a custom 1,000 W thermal design lifted the gap to 43 percent in the server scenario and 45 percent offline. The 1,000 W configuration needs custom cooling from system builders, so it does not describe a standard H200 server.
The spread between 28 percent and 90 percent for the same model family is the first lesson. A controlled benchmark at equal power gives the lower figure. A vendor’s best-case configuration at larger batch sizes gives the higher one. Neither is wrong; they answer different questions.
The independent test: three regimes in one model
Baseten tested eight H200s, rented from Lambda, against eight H100s on Mistral Large, a 123-billion-parameter model, using TensorRT-LLM. Its three results span the whole range. With long inputs of 32,784 tokens at a batch of 64 and BF16 weights, the H200 cluster delivered 3.4 times the performance. With a large batch of short requests, the gain was 47 percent in BF16 and 36 percent in FP8. With short inputs and long outputs at a batch of 64, it was roughly equal in BF16 and 11 percent in FP8.
The long-input result is the memory effect in its purest form. A 32,784-token prompt makes a large cache, and the H100 cluster, with 640 GB in total, ran short of room, while the H200 cluster with 1,128 GB did not. The short-context result is the opposite case. When the cache is small, both clusters fit the job, and the extra capacity sits idle. Baseten’s own conclusion is blunt: outside the favourable workloads, the H200 offered minimal improvement over the H100, and many inference tasks are cheaper on the H100.
It also suggests a split worth knowing about: running prompt processing on H100s and token generation on H200s, since the first is compute-bound and the second memory-bound. It follows directly from the physics in the previous section.
Reading the ratios
Put the figures in order and a pattern appears. When the working set fits in 80 GB with room to spare, the gain is zero to about 30 percent, which tracks the bandwidth ratio of 1.43 only when the decoder is purely bandwidth-limited. When the working set is squeezed in 80 GB, the gain is 50 to 90 percent. When it overflows 80 GB and forces the H100 to recompute or to split work across more cards, the gain can be several times. Your own gain depends on where your job sits on that scale, which is why the only reliable number is one you measure.
NVIDIA’s later MLPerf round adds one caution. Its Inference v5.0 post says H100 throughput on Llama 2 70B rose by up to 1.5 times over the previous year from software alone. Software moves faster than hardware here, and any ratio measured on one release of the serving stack can change by a third on the next. Re-run the comparison whenever the stack changes.
Cost per token from a public benchmark
InferenceX, the open inference benchmark that SemiAnalysis maintains, publishes a cost-per-million-tokens comparison of the two cards on Llama 3.3 70B at 8-bit precision. The version we read states that it is an unofficial copy of the benchmark, and it prices both cards at a hyperscaler’s ownership cost: $1.17 per GPU-hour for the H100 and $1.22 for the H200, a premium of about four percent.
At those prices the H200 comes out ahead at every point on the curve. At 38 tokens per second per user it costs $0.10 per million tokens against $0.18 for the H100, at 58 tokens per second $0.13 against $0.28, and at 78 tokens per second $0.18 against $0.37. The H200 also serves more concurrent users at each point, about 32 against 20 at the first. This is the memory argument expressed in dollars, and it shows what the H200 can do when its price premium is small.
It does not describe a rental customer. A buyer who rents on demand pays the market premium, not the ownership premium, and the market premium is the next section’s subject. The InferenceX numbers are best read as an upper bound on the benefit: the benefit when the price gap is almost nothing.
What each card costs to rent
The index side by side
Our index records 15 H100 price points from 11 providers and 13 H200 price points from 9 providers. Table 4 puts the two cards next to each other on the median on-demand price, the 12-month reserved rate where one is published, memory, and the median price per gigabyte of memory.
Table 4H100 and H200 in the rental index, USD per GPU-hour
| Model | Median | 12-mo reserved | Memory | Median per GB of memory | Median × 730 h | Floor | Ceiling | Providers |
|---|---|---|---|---|---|---|---|---|
| H100 | $3.90 | $3.26 | 80 GB | $0.049 | $2,847 | $1.30 | $12.29 | 11 |
| H200 | $4.80 | $3.40 | 141 GB | $0.034 | $3,504 | $2.09 | $13.78 | 9 |
USD per GPU-hour, on-demand unless stated. Compute Census GPU price index of 6 Nov 2026.
The table answers two different questions. On price per GPU-hour, it shows the premium a buyer pays for the switch. On price per gigabyte, which is the better measure for memory-bound work, the H200’s price is $0.034 against $0.049 for the H100. A buyer who needs the memory is paying for it at a rate that can be higher or lower than the H100’s, and the table shows the current position. CloudZero, writing in autumn 2026, puts the H200’s rental premium at roughly 35 percent and frames the decision the same way: pay it when models are memory-bound and skip it when they are not.
Quote by quote
The median hides the structure behind it. Tables 5 and 6 list the individual quotes, and the first thing to look for is the same provider offering both cards. That pair is the cleanest price ratio available, because the provider, the terms and the platform are held constant.
Table 5H100 prices by provider, USD per GPU-hour
| Provider | Offer | USD / GPU-hr | As of |
|---|---|---|---|
| Lium.io | Marketplace | $1.30 | 2026-09-21 |
| Beam | On-demand | $1.83 | 2026-10-20 |
| CoreWeave | Spot | $2.46 | 2026-10-20 |
| Runpod | On-demand | $2.69 | 2026-10-16 |
| Civo | Reserved, 12 mo | $2.69 | 2026-10-20 |
| Civo | On-demand | $2.99 | 2026-10-20 |
| DigitalOcean | Reserved, 12 mo | $3.26 | 2026-09-28 |
| Runpod | On-demand | $3.99 | 2026-10-16 |
| Lambda | On-demand | $3.99–$4.29 | 2026-10-16 |
| DigitalOcean | On-demand | $4.41 | 2026-10-20 |
| Nebius | On-demand | $4.50 | 2026-10-16 |
| CoreWeave | On-demand | $6.16 | 2026-10-20 |
| AWS | On-demand | ~$6.88 | 2026-10-16 |
| Google Cloud | On-demand | ~$11.00 | 2026-10-16 |
| Microsoft Azure | On-demand | $12.29 | 2026-10-16 |
Price points recorded by the Compute Census index for the H100; third-party index rows are context, not providers. Full table: H100 rental price.
Table 6H200 prices by provider, USD per GPU-hour
| Provider | Offer | USD / GPU-hr | As of |
|---|---|---|---|
| Jarvislabs | Spot | $1.99 | 2026-09-21 |
| Beam | Serverless | $2.09 | 2026-09-21 |
| Beam | On-demand | $2.09 | 2026-10-20 |
| GMI Cloud | On-demand | $2.60 | 2026-09-21 |
| Civo | Reserved, 12 mo | $3.19 | 2026-10-20 |
| DigitalOcean | Reserved, 12 mo | $3.40 | 2026-09-21 |
| Civo | On-demand | $3.49 | 2026-10-20 |
| Jarvislabs | On-demand | $3.99 | 2026-09-21 |
| GetDeploying median | Third-party index | $4.40 | 2026-09-21 |
| DigitalOcean | On-demand | $4.47 | 2026-10-20 |
| Runpod | On-demand | $5.29 | 2026-10-20 |
| Nebius | On-demand | $5.40 | 2026-10-20 |
| CoreWeave | On-demand | $6.31 | 2026-10-20 |
| Microsoft Azure | On-demand | $13.78 | 2026-09-21 |
Price points recorded by the Compute Census index for the H200; third-party index rows are context, not providers. Full table: H200 rental price.
Where one provider lists both, divide the H200 price by the H100 price. That ratio, not the ratio of medians, is the premium you would pay for the switch. Ratios of medians mix providers, and the range of prices across providers is wider than the gap between the two cards. The H100’s cheapest offer is $1.30 and the H200’s is $2.09; at the top, list prices reach $12.29 and $13.78. A well-chosen H100 provider can undercut a poorly chosen H200 provider by a wide margin, and the reverse can also happen.
A hyperscaler pair
AWS publishes a clean example in its Capacity Blocks price list, which reserves instances for a fixed window at a published rate. In US East (Ohio), a p5.48xlarge block with eight H100s costs $47.757 per instance-hour, or $5.970 per GPU-hour. A p5e.48xlarge block with eight H200s costs $54.924, or $6.866 per GPU-hour, and a p5en.48xlarge block with eight H200s costs $63.158, or $7.895 per GPU-hour.
The two H200 prices put the premium over the H100 block at a minimum of 15 percent and a maximum of 32 percent, on the same provider and the same reservation terms. That is a computed ratio from published prices, not a measured one for your job. AWS says the current prices are scheduled for their next update in January 2027, and that Capacity Block prices follow supply and demand, so these figures will not last.
How the prices have moved
Figure 1H100: median on-demand rental price and published range, USD per GPU-hour, 2023-06-01 to 2026-11-06
Figure 2H200: median on-demand rental price and published range, USD per GPU-hour, 2025-03-01 to 2026-11-06
Against 1 Oct 2025, the H100 median has moved +100%, and the H200 median has moved +41% over the same period. The history matters for this decision for a reason that is easy to miss. The ratio between the two prices is not fixed, and it drifts as demand shifts between memory-heavy and compute-heavy work. A comparison made at one snapshot can reverse within a few months.
Hopper rental prices did not follow the path most observers expected. Our guides on whether GPU rental prices are going up and on the GPU shortage trace that turn in detail. For this choice the relevant point is that the ratio between the two prices is a market outcome and not a fixed property of the cards, so it has to be read again at the date you buy.
From speed-up to cost per job
The rule
An hourly price is not what a team pays for. It pays for a finished job: a fine-tune completed, a batch of documents processed, a million tokens served. If the H200 finishes the same job in a fraction of the H100’s time, its higher rate is spread over fewer hours.
Write the premium as P, the H200’s hourly price divided by the H100’s. Write the speed-up as S, the number of times faster the H200 completes your job. The H200’s cost per job, as a multiple of the H100’s, is P divided by S. If S is larger than P, the H200 is cheaper per job. If it is smaller, the H100 is. At equal values the cost is the same, and the H200 still returns results sooner.
This is the same rule we use for the H100 against the A100; only the inputs differ. For P, divide the two prices from the provider you plan to use. For S, use a measurement of your own job and, failing that, the ranges in Table 3.
A lookup table
Table 7 uses no price from our index. It gives the H200’s cost per finished job as a multiple of the H100’s for a range of premiums and speed-ups. The speed-up columns run from 1.0, where memory plays no part, to 1.9, NVIDIA’s best launch figure.
| Premium P (H200 hour ÷ H100 hour) | S = 1.0 | S = 1.2 | S = 1.5 | S = 1.9 |
|---|---|---|---|---|
| 1.2 | 1.20 | 1.00 | 0.80 | 0.63 |
| 1.4 | 1.40 | 1.17 | 0.93 | 0.74 |
| 1.6 | 1.60 | 1.33 | 1.07 | 0.84 |
| 2.0 | 2.00 | 1.67 | 1.33 | 1.05 |
Table 7. H200 cost per finished job as a multiple of the H100’s. Below 1.00 the H200 is cheaper per job. Arithmetic only; no data from our index.
What the table implies
Read the row for a premium of 1.4, close to the 35 percent CloudZero reports. At no speed-up the H200 costs 40 percent more per job. At the 28 percent MLPerf gain, S = 1.28, it is still more expensive, by about nine percent. It breaks even at S = 1.4 and is cheaper beyond that. Reaching 1.4 on a Llama 2 70B class job is plausible when the H100 is memory-constrained, and unlikely when it is not.
Now read the row for 2.0. At a doubled hourly price, even NVIDIA’s best launch figure leaves the H200 about five percent more expensive per job. A provider that charges twice as much for the H200 has priced the memory above what most workloads can use, and the H100 wins unless the job truly overflows 80 GB.
Finally the row for 1.2, close to the low end of the AWS pair. At a speed-up of 1.2 the two cards cost the same per job, and anything above that favours the H200. When the premium is small, the H200 is hard to beat, and the InferenceX result above is the limiting case.
Cases where the table understates the H200
The table assumes one H200 replaces one H100. When the job needs two H100s and fits on one H200, S is not a speed-up in the usual sense. It is the ratio of GPU-hours needed, which can be 2.0 or more, plus the saved communication time. In that case the right comparison is one H200-hour against two H100-hours, and the premium would have to exceed 2.0 for the H100 pair to win. This is the workload where the H200 earns its price, and it is common for models between 70 and 140 billion parameters at 8-bit precision.
Time has a price as well. A job that finishes sooner returns an answer sooner, which matters for interactive services and for research with a deadline. The table counts only dollars. A team that prices an hour of waiting should add it to the slower card’s column before comparing.
Power, cooling and the campus
The same box
The H100 and H200 SXM modules share a 700 W ceiling, and NVIDIA’s DGX documentation gives the same 10.2 kW maximum for the DGX H100 and DGX H200 systems. An operator swapping one for the other changes nothing in the building. The H200 page makes a corresponding claim about energy, saying that the H200 offers the same power profile as the H100 and giving no figure. That claim follows from the table: if a job runs 28 to 90 percent faster on equal power, it uses less energy.
The NVL cards break that symmetry. The H200 NVL is rated up to 600 W against 350 to 400 W for the H100 NVL, so a rack of NVL cards draws more after the upgrade, and an air-cooled design has to remove the extra heat. If you plan on PCIe-style cards in standard servers, check the power budget of the rack before ordering.
What a mixed fleet means
Many operators will run both. They already own H100s and add H200s for the memory-heavy services, and the fleet then contains two kinds of node with different best uses. Scheduling jobs by memory footprint, with long-context and large-model work on the H200 and the rest on the H100, makes the most of both. It also argues against replacing a working H100 cluster in order to chase a gain that may be zero for its workload.
Where the GPUs live
Both cards need somewhere with power. Our census of AI campuses counts 665 campuses in 56 countries as of 15 Nov 2026, with 51.1 GW under construction and 37.6 GW announced. The median campus that publishes a capacity figure is rated at 70 MW.
Table 8AI campuses in the census by published capacity class
| Capacity class | Campuses | With published MW | Published MW |
|---|---|---|---|
| 1 GW or more | 27 | 27 | 41,730 |
| 500–999 MW | 18 | 18 | 11,386 |
| 100–499 MW | 156 | 156 | 33,370 |
| Under 100 MW | 295 | 295 | 11,380 |
| Not published | 169 | 0 | 0 |
Compute Census AI campus census, records to 15 Nov 2026. MW summed only where a source publishes a figure. Full list: AI data center census.
The H100 versus H200 choice does not change a campus plan, because the power per GPU is the same. It changes how much work a given megawatt delivers. If an H200 serves more users at the same power, power-limited operators get more output from the same electrical connection, and that is a reason for new inference capacity to be built on memory-rich parts. Our census shows where the megawatts are; this guide shows what a GPU does with them.
Buying the hardware
No list price for either
NVIDIA publishes no list price for either card, and most units reach buyers inside complete servers on negotiated terms. CloudZero’s autumn 2026 comparison gives the best public marker for the H100, at about $31,000 for a new card, with used cards at $25,000 to $35,000. For the H200 it says only that the price is quote-based and at a premium. We found no published price for a complete H200 server, so this guide prints none. Our H200 guide lists the one public card listing we found.
Systems and lead times
Because the DGX H100 and DGX H200 share a chassis, power rating and weight, a data center prepared for one can take the other. The practical difference at purchase is availability. The H100 is the older part, and buyers of new hardware may find fewer new H100 systems on offer than H200 or Blackwell systems, a trend we describe in our H100 price guide. For a purchase meant to last four to six years, buying the older part means buying less memory for the same rack.
Rent first, then decide
Because the answer depends on where a workload sits between 80 GB and 141 GB, the sensible order is to rent both, measure, and only then buy. A day’s trial on each card costs little against a purchase measured in hundreds of thousands of dollars per server. The measurement should use your own model, your own prompt lengths and your own concurrency, at the precision you intend to run.
Which one for which job
Large language model inference
The H200 earns its price on models between about 30 and 140 billion parameters at 8-bit precision, where weights take most of an H100’s memory and the cache is squeezed. It does so again for long-context services, since cache grows with context length. The H100 is enough for models of 13 billion parameters or fewer, and for any service where requests are short and the cache is small. Table 2 and Table 3 above are the guide: if the cache budget on an H100 allows only a few concurrent conversations at your context length, the H200 is the better fit.
Very large models
Models of several hundred billion parameters need several GPUs of either type, and the comparison moves from one card to a cluster. The dstack test on Llama 3.1 405B shows an eight-H100 server running out of cache at modest batch sizes with long prompts. An eight-H200 server has 1,128 GB against 640 GB, a gain of 76 percent in memory for the same chassis and power. When cluster size is set by memory, the H200 can cut the number of servers needed.
Training and fine-tuning
For training the case is weaker, because the compute is identical and most of the work is arithmetic, not memory traffic. Extra memory can reduce the amount of parallelism a model needs and so improve efficiency, but the bigger step up for training is Blackwell, which adds compute as well as memory. Fine-tuning with adapters on mid-sized models often fits comfortably in 80 GB. Full fine-tuning of larger models is the exception: optimiser state is large, and the H200’s room can allow a larger batch per GPU.
Batch and offline work
Large latency-insensitive batches are where Baseten saw a 36 to 47 percent gain on an eight-GPU cluster, and they are the second natural home of the H200. The gain comes from running big batches with the cache held in fast memory. If the batch job runs at night on idle capacity, the lower cost per token can outweigh a higher hourly price.
Development, testing and small services
Anything that does not stress 80 GB belongs on the H100, or on a smaller and cheaper card. A development environment, a classifier, an embedding service, an image model of moderate size: none of these has a reason to pay for 141 GB. Our guide to the A100 against the H100 covers that end of the market.
Five questions before choosing
- Does the model, at the precision you will run, leave at least a third of an 80 GB card free for the cache?
- What is the longest context you will serve, and how many conversations at once?
- Is the job limited by time to first token, which does not improve, or by generation speed, which does?
- What is the premium P at your provider, and what is the speed-up S on a one-day trial?
- Could two H100s do the work for less than one H200, once the link between them is counted?
If the answers to the first two questions are comfortable, stay on the H100. If the third points to prompt processing, the H200 will disappoint. If the last two give P below S, move.
How to source H100 and H200 capacity
Decide what you are buying
Start with the job and its memory footprint, then the horizon. Memory-bound inference that will run for years on stable models can justify a purchase if a site with power exists. Anything uncertain is better rented, on terms that allow a move to Blackwell when the model grows. Our index of GPU rental prices and the model pages for the H100 and H200 show current quotes, and the methodology explains how the figures are built.
Questions for a provider of rented capacity
- Is the price for dedicated nodes, shared pools, spot or serverless capacity, and for which card variant?
- Is the H100 an 80 GB SXM module, or a 94 GB NVL card?
- What is the term, and what are the exit terms?
- Which fabric links the nodes, and at what speed per GPU?
- What happens when a node fails, and how fast is it replaced?
- Can I run a day’s trial of both cards on the same platform?
Questions for a seller of hardware
- Which variant is it: SXM on an HGX board, or an NVL card?
- New, refurbished or used, with what warranty and history?
- What is in the server besides the GPUs, and what is the lead time?
- What export paperwork applies to the destination country?
- Where will it be hosted, and is that power contracted today?
We handle both routes. GPU capacity is available for rent and hardware for purchase, through different partners, and the terms are agreed individually for each request: there is no fixed commission and no fixed minimum. Tell us the card, quantity, location and timing in the form below, and we come back with what is available and on what terms.