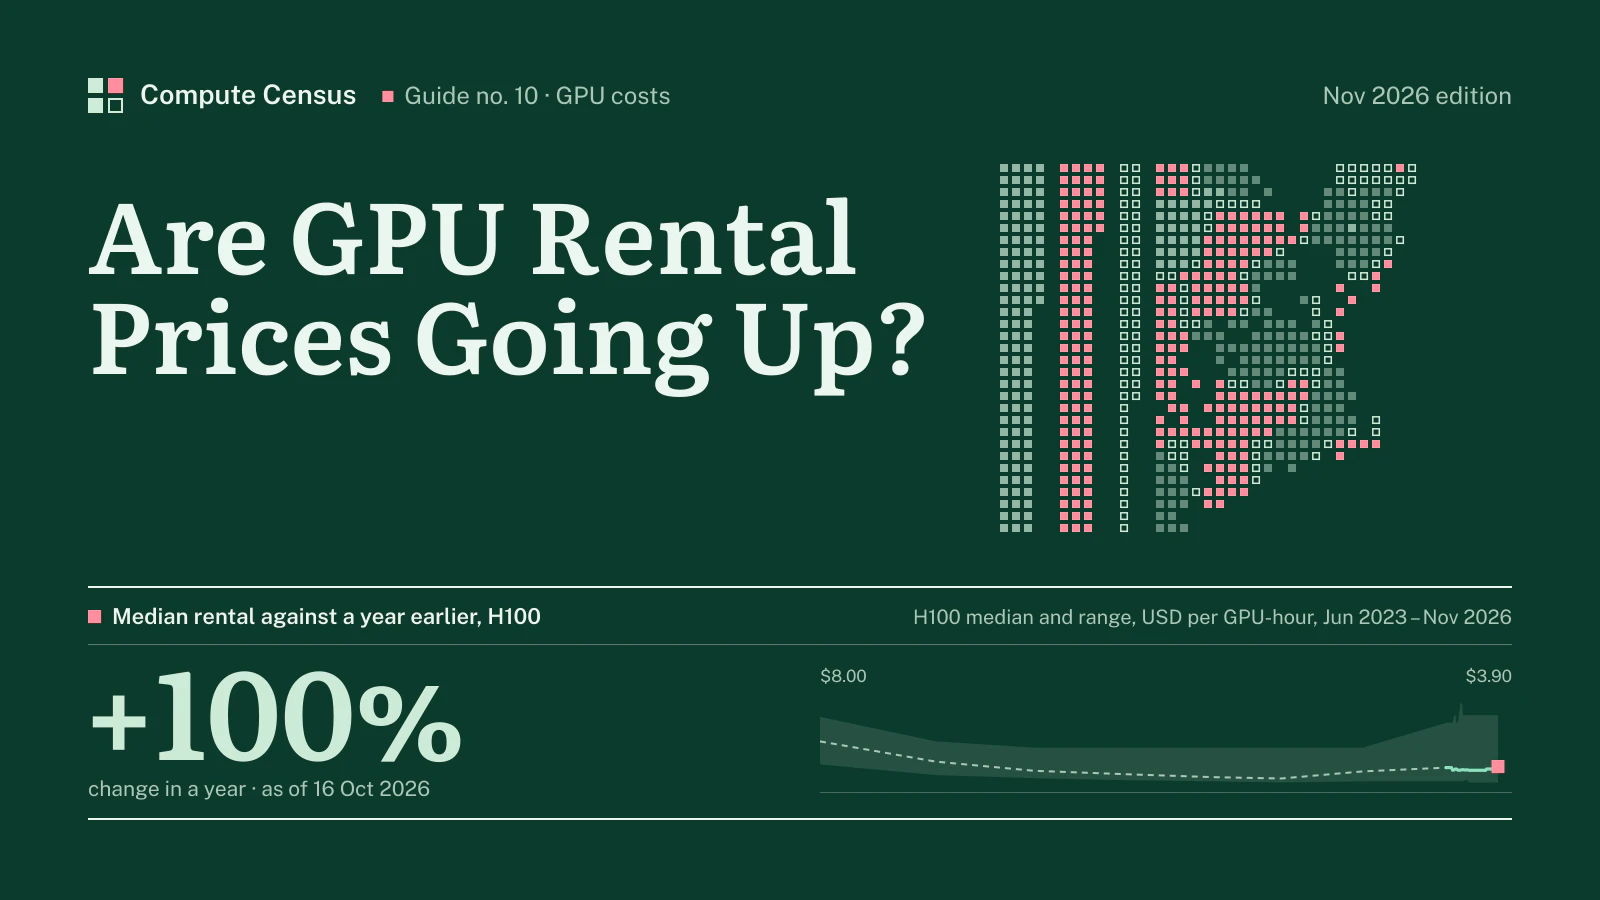
The short answer
Yes, for the main data center GPUs, the direction since early 2026 has been up. That is a reversal. From the 2023 peak to the autumn of 2025, the rental price of an H100 fell almost every quarter, and a whole generation of buyers learned to wait. The waiting stopped paying.
For the main data center parts, the published evidence says yes since early 2026, after a long decline. SemiAnalysis recorded its one-year H100 contract rate at about $1.70 per GPU-hour in October 2025 and about $2.35 in March 2026. That is a rise of roughly 38 percent in five months, measured on what buyers say they signed.
Our index measures something else: published on-demand and reserved prices from provider price lists. At the 6 Nov 2026 snapshot the median on-demand H100 price is $3.90 per GPU-hour. Against 1 Oct 2025 it has moved +100%. The other nine models in the index have their own paths, and they do not all agree, which is the main reason a single “yes” is too blunt.
This guide is a reading aid for price news. We set out what “price” can mean, show the two-year path, give our ten models one by one, list the provider changes that can be checked on a price page, and compare the public trackers, which disagree by a factor that surprises people. We end with what the movement means for a buyer. Every external figure carries its date and owner and is listed on our Sources page. Every figure from our own index updates with the index.
What “the price” means
Four prices for one chip
Questions like “are GPU prices going up” assume that a GPU has a price. It has at least four, and they move independently.
The first is the on-demand list price: what a provider charges per GPU-hour with no commitment. Our index records this, and so do most of the public trackers. The second is the reserved or contract price: what a buyer pays for a committed term, from three months to three years. SemiAnalysis surveys this one. The third is the spot or preemptible price, which a provider can reclaim and which tracks idle capacity from hour to hour. The fourth is the purchase price of the hardware, which belongs to a different market with different partners.
A news item that says “H100 prices rose 10 percent” is true of exactly one of these and says nothing about the other three. When a headline does not say which price it means, treat the number as a hint, not a measurement.
Hyperscalers, neoclouds and marketplaces
The provider matters as much as the price type. Hyperscalers such as AWS, Azure and Google Cloud list the same chip at a multiple of the neocloud rate. Uvik’s compilation of price pages captured on 7 October 2026 gives an H100 SXM median of $10.53 per GPU-hour across four hyperscalers and $3.95 across twelve GPU clouds. Its ratio of hyperscaler to GPU-cloud medians runs from 1.7 times for the L40S to 2.7 times for the H100 SXM.
Marketplaces sit at the bottom. They list single hosts, often with no guarantee that the host is still there next week. The Implicator survey of trackers in July 2026 found a marketplace spot listing for the H100 at $0.94 per hour. Against a hyperscaler benchmark at the lower bound of $7.40, that is the “eight times” gap in its headline.
Why the mix matters for any average
A median of listed prices changes when a provider changes its price. It also changes when a provider joins or leaves the sample, and when the cheapest listing sells out. Our 11 H100 providers can move the median by themselves if two or three of them reprice on the same week. We say this up front because the same caution applies to every index in this guide. A thin sample is a reason to read the direction, not the second decimal.
Where prices have been
The fall from the 2023 peak
The H100 reached the market in 2023 at prices that look strange today. Our own series starts from published market indices, and the earliest point puts the H100 median at $8.00 on 1 Jun 2023. Supply grew, new neoclouds entered the market and demand from the first wave of model training eased. Prices fell, year after year.
Figure 1H100: median on-demand rental price and published range, USD per GPU-hour, 2023-06-01 to 2026-11-06
The shape matters more than any single point. The fall was steep at first and slower later, and it flattened before it turned. The turn is what the current question is about, and our series places the peak median at $8.00 on 1 Jun 2023. The last recorded move is +1.8%, dated 6 Nov 2026.
The June 2025 price cuts
The fall was not only market drift. In June 2025 AWS cut its on-demand prices by 44 percent for P5 instances (H100), 25 percent for P5en instances (H200) and 33 percent for P4d and P4de instances (A100). The cut applied to on-demand purchases from 1 June 2025 and to Savings Plan purchases after 4 June 2025, according to the AWS announcement. Savings Plan reductions differed by plan and term.
A hyperscaler cutting by that much tells you where the market stood. A provider with the largest customer base does not cut a flagship price by almost half unless the neocloud rates underneath have already pulled the market down. It was a late signal of a trend that had run for two years.
The October 2025 trough and the turn
SemiAnalysis launched a monthly survey-based index of one-year H100 contracts in 2026. By its account the contract rate reached a low of about $1.70 per GPU-hour in October 2025, passed $2 in late January 2026, and reached about $2.35 by March 2026. It jumped 15 to 20 percent between the end of January and mid-to-late February alone. Its authors concluded that pricing was “only going one way for now” and expected further monthly rises. That is a forecast, and a forecast has a date.
The survey covers more than 100 market participants, including neocloud providers, buyers and sellers of compute, and reports the range between the 25th and 75th percentile. It also checks its results against transaction data. For contract prices it is the best public source, and it is a survey, not a price list.
Silicon Data’s daily neocloud index tells a similar story from another angle. The analysis at explainx.ai, citing Silicon Data, puts the H100 neocloud rate at $2.00 per GPU-hour on 9 December 2025 and $2.20 on 6 January 2026. Its author notes that 9 December was a local low, so any percentage measured from that date overstates the rise. We return to that point below.
Ten models in our index
The full table
Our index holds ten models: Hopper and Blackwell parts, two AMD accelerators, an older A100, the L40S and two consumer cards. The table sets out where each stands now.
Table 1Median on-demand and reserved rates, ten models, USD per GPU-hour
| Model | Median | 12-mo reserved | Floor | Ceiling | Providers |
|---|---|---|---|---|---|
| H100 | $3.90 | $3.26 | $1.30 | $12.29 | 11 |
| H200 | $4.80 | $3.40 | $2.09 | $13.78 | 9 |
| B200 | $6.90 | not published | $3.69 | $16.11 | 12 |
| GB200 | $13.25 | $10.58 | $8.00 | $27.04 | 5 |
| A100 | $1.75 | $1.59 | $0.53 | $5.07 | 8 |
| L40S | $1.53 | $1.09 | $0.38 | $3.77 | 10 |
| MI300X | $2.99 | $1.91 | $1.71 | $12.00 | 7 |
| MI355X | $7.00 | $4.25 | $5.99 | $8.60 | 6 |
| RTX 5090 | $0.72 | not published | $0.25 | $1.09 | 3 |
| RTX 4090 | $0.42 | $0.27 | $0.13 | $0.74 | 4 |
USD per GPU-hour, on-demand unless stated. Compute Census GPU price index of 6 Nov 2026.
Read the last column first. A model with three or four providers is a thin market, and its median can move for reasons unrelated to demand. The H100 and the A100 have the deepest samples. The newest parts have the shallowest.
How far each one has moved
The table below shows the change against a year earlier, where our record reaches that far back. Cells that have no year-ago point show the field as unavailable; we do not fill gaps.
| Model | Median now | Change vs year ago | Year-ago date |
|---|---|---|---|
| H100 | $3.90 | +100% | 1 Oct 2025 |
| H200 | $4.80 | +41% | 1 Oct 2025 |
| B200 | $6.90 | 0% | 1 Dec 2025 |
| A100 | $1.75 | not published | not published |
| MI300X | $2.99 | −12% | 1 Oct 2025 |
The five rows are the ones with the longest records. Each row is its own market. Some of them have moved in a way that matches the H100, and some have not. A buyer who treats the H100 as the market will mislead themselves about the others.
The Hopper pair
The H200 is the closest relative of the H100 and the one whose price is tied most tightly to it. Its median is $4.80 against $3.90 for the H100. The H200 carries 141 GB GB of memory against 80 GB GB, so the price per gigabyte of memory is $0.034 against $0.049 per GPU-hour. Our guide to the NVIDIA H200 price covers that comparison in detail.
Figure 2H200: median on-demand rental price and published range, USD per GPU-hour, 2025-03-01 to 2026-11-06
The history of the H200 is shorter, because the part is newer. That alone makes its trend less certain. Two years of falling prices are visible for the H100. For the H200 we have only the months since it entered published price lists.
Blackwell
The B200 is the first part in the index whose price is set by allocation as much as by competition. Its median is $6.90 with a floor of $3.69 and a ceiling of $16.11. The spread between those two numbers is 4.4×, and a wide spread in a new part is normal: some providers sell it at list and others discount to win a customer.
Figure 3B200: median on-demand rental price and published range, USD per GPU-hour, 2025-06-01 to 2026-11-09
For the GB200, the rack-scale NVL72 system, our index reports a price per GPU. It is the thinnest sample of the ten, with 5 providers. We include it because buyers ask about it, not because the median is stable. Treat its movement as an anecdote until the sample grows.
The old and the cheap
The A100, launched in 2020, is still rented in volume. Its median is $1.75. The L40S, an inference-oriented card, sits at $1.53, and the consumer cards at the bottom, the RTX 4090 and the RTX 5090, at $0.42 and $0.72. At those levels a change of ten cents is a large percentage, and a large percentage on a small price is usually noise.
There is a second reason to be careful with old parts. The 2025 price lists and the 2026 price lists do not always include the same providers. A provider that dropped the A100 from its list removes a data point, and if the provider was cheap, the median rises without anyone raising a price. That is a sampling effect and it is the first thing to check in any claim that old GPUs are getting dearer. Our guide to the NVIDIA A100 price goes through this.
AMD
AMD’s MI300X is a case of a competitor priced against the H100. Its median is $2.99, with 192 GB GB of memory. The newer MI355X has 6 providers in the index and a median of $7.00. For AMD parts the question “are prices going up” is mixed with a second question, which is whether providers have enough of them to quote at all.
Provider price changes you can check
Nebius
The cleanest evidence is a price page that changed. Nebius lists on-demand prices per GPU-hour of $4.50 for the H100, $5.40 for the H200, $8.50 for the B200 and $9.50 for the B300. Uvik’s compilation records the H100 at $3.85 before 1 October 2026 and the H200 at $4.50, so the increases were 17 and 20 percent. The page itself says prices may be changed by Nebius at any time.
It also says that customers can pay less than on-demand rates by reserving large clusters for several months, and it does not publish the discount. That is common. The list price is public and the discount is negotiated, so the list price is the part of the market we can observe, and the discount is the part we cannot.
AWS
AWS is the largest cloud and the one whose price changes get the most attention, so it is worth stating what the record shows. In June 2025 it cut on-demand prices for the GPU families covered above. In its Capacity Blocks for ML pricing, a block is charged at the rate in effect when it is bought. The page lists $47.757 per instance-hour for an eight-GPU H100 instance, which is $5.970 per GPU-hour, and $14.208 per GPU-hour for the eight-GPU B200 instance. It says rates are updated regularly to reflect supply and demand, and that the next update is scheduled for January 2027.
Uvik’s compilation reports that AWS raised Capacity Block prices by about 15 percent on 7 October 2026 and left on-demand prices unchanged. We read that as a secondary report of a change, and the AWS page is the primary source for the current rates. We have not found an AWS notice that states the percentage itself.
A pattern in the changes
The two providers differ, and the difference is informative. Nebius moved its on-demand list. AWS moved the product that is sold in advance, where the buyer reserves capacity for a fixed window. In a market where on-demand capacity is scarce, a provider has a reason to raise the price of the product that gets a customer a guaranteed slot first, and to keep the headline on-demand price steady. A buyer who looks only at on-demand list prices can miss that.
Why the public trackers disagree
Four instruments, one chip
By July 2026 the Implicator survey of trackers counted several measures of the same H100 price. GetDeploying listed a range from $0.35 to $14.90 per GPU-hour across 49 providers, with a median on-demand price of $3.25. Silicon Data’s hyperscaler on-demand index held between $7.40 and $7.52 from 1 March to 20 April 2026. Its neocloud index read $2.53 at the time of the survey. Gpuinstances showed a spot listing at $0.94.
Uvik’s list median for the H100 SXM on 7 October 2026 was $4.20, against $2.81 for the Silicon Data neocloud series the same week. Uvik’s own table shows Ornn’s index at $2.86 on 6 October and the latest public SemiAnalysis composite at $2.82 in April.
They measure different things. A marketplace spot listing, a hyperscaler on-demand list price, a neocloud index and a one-year contract survey can sit several times apart for the same chip, and none of them is wrong. The Silicon Data neocloud series is built to standardise for machine, rental terms, platform performance and geography, and it covers neoclouds. A list median includes hyperscalers, whose prices are several times higher, and counts each provider once. A spot listing is a different product altogether. Our own median uses published provider prices and sits in the same family as a list median.
What a good index discloses
The hyperscaler series is useful evidence of how a stable index behaves. Between 1 March and 20 April 2026 it was unchanged on 39 of 50 daily transitions and its net move was a decline of 0.27 percent. Hyperscaler list prices barely move. That is why hyperscaler averages say little about a market where the neocloud rate is the one in motion.
Silicon Data announced its first daily GPU rental index in May 2025, and Data Center Knowledge described it as normalised for GPU type, platform and hardware configuration. Banks license it for risk management, hedge funds license the underlying data, and asset managers use it when financing data centers. CME Group announced in May 2026 a partnership with Silicon Data to build compute futures that settle against its indices. When a number is used to settle contracts, it gets documented in detail; that is a point in the index’s favour and a reason to prefer it to a bare headline.
Reading a tracker
Before you use any of these numbers, ask five things. Which price type does it measure: on-demand, spot or contract? Which providers are in it, and are hyperscalers mixed with neoclouds? Is the figure a median, a mean or a floor? On which date was it captured? And how many providers sit behind it?
If the source cannot answer, the number is a rumour with a decimal point. If it can, you can compare it with ours. We state our sample in the open: 15 H100 quotes from 11 providers at the 6 Nov 2026 snapshot, with the full table below.
Table 2H100 prices by provider, USD per GPU-hour
| Provider | Offer | USD / GPU-hr | As of |
|---|---|---|---|
| Lium.io | Marketplace | $1.30 | 2026-09-21 |
| Beam | On-demand | $1.83 | 2026-10-20 |
| CoreWeave | Spot | $2.46 | 2026-10-20 |
| Runpod | On-demand | $2.69 | 2026-10-16 |
| Civo | Reserved, 12 mo | $2.69 | 2026-10-20 |
| Civo | On-demand | $2.99 | 2026-10-20 |
| DigitalOcean | Reserved, 12 mo | $3.26 | 2026-09-28 |
| Runpod | On-demand | $3.99 | 2026-10-16 |
| Lambda | On-demand | $3.99–$4.29 | 2026-10-16 |
| DigitalOcean | On-demand | $4.41 | 2026-10-20 |
| Nebius | On-demand | $4.50 | 2026-10-16 |
| CoreWeave | On-demand | $6.16 | 2026-10-20 |
| AWS | On-demand | ~$6.88 | 2026-10-16 |
| Google Cloud | On-demand | ~$11.00 | 2026-10-16 |
| Microsoft Azure | On-demand | $12.29 | 2026-10-16 |
Price points recorded by the Compute Census index for the H100; third-party index rows are context, not providers. Full table: H100 rental price.
How big has the move been?
The claim of a 45 percent rise
On 24 October 2026 a post on X said H100 rental costs were up 45 percent since December, citing Silicon Data. The explainx.ai analysis checked it. From the $2.00 base on 9 December 2025, the reading of $2.81 on 15 October is about 40.5 percent higher. A 45 percent rise would land near $2.90. The neocloud reading of $2.88 on 24 October is about 44 percent above the base, close to the claim but not identical.
The analysis adds two points. The percentage depends on the tier and the start date, and 9 December was a local low. A different start date gives a different number. It also notes that Silicon Data publishes daily rental indices that sample listed offers, so thin listings can move an index when a few providers reprice.
That is a good model of how to read a price headline. The figure was in the right range, the direction was real, and the exact size depended on choices the headline did not state.
The H200 premium
Silicon Data’s own analysis of the neocloud tier from 4 May to 27 July 2026 gives a precise view of the H200 and the H100 side by side. The H200 rose 14.4 percent over twelve weeks, from $2.70 to $3.09, and the H100 rose 7.0 percent, from $2.57 to $2.75, with a decline in June and a partial recovery. The H200 premium over the H100 averaged 5.8 percent in May and 12.1 percent in July, with a range from 0.4 to 16.2 percent in the window.
The author adds two cautions. The daily changes of the two series were uncorrelated, so co-movement is not supported by the data yet. And under three months of history is too little to confirm a trend. The premium widened because the H200 rose, not because the H100 fell, and the author calls memory-bound inference demand a plausible but unproven explanation.
For a buyer the practical point is simple. The two Hopper parts do not move together day to day, so a price check on one is not a price check on the other.
Levels differ between sources, not only direction
The same Silicon Data window put the H200 at about $3 per GPU-hour. Uvik’s compilation of list prices has an H200 median of $5.70 in October, and the Nebius page lists $5.40. TechNews, reporting in August 2026, gave H100 rates as “just under $2” in January and “approaching $3” by then, and a B200 move from just under $5 to about $5.50 to $5.80. Those figures cite Silicon Data and unnamed datasets. We use them only for direction.
The direction agrees across all of them. The levels do not, and for the reasons in the previous section they should not. Do not average them.
Why prices are rising
Demand for rented compute
We keep the causes short, because our guide to the GPU shortage covers supply limits in depth. The short form is this. Demand for compute from labs and from inference workloads grew faster than the supply of powered, networked capacity. SemiAnalysis names AI labs, inference demand and neoclouds locking in hardware ahead of further increases as the drivers behind its expectation of rising prices.
Inference matters here because inference jobs run continuously. A training run ends and releases its cluster. A service that answers queries keeps its GPUs busy for as long as it has users. Memory-bound inference favours parts with more memory per GPU, which is one reason the H200 and the B200 are examined so closely.
Supply that does not respond quickly
A price rise would normally pull in supply. For GPUs the lag is long, because a rented GPU needs a server, a building and a power connection. Our census of AI campuses records 51.1 GW GW under construction and 37.6 GW GW announced across 665 campuses, against 9.1 GW GW operational. The gap between announced and operating capacity is what the market is waiting for.
Table 3AI campuses in the census by status
| Status | Campuses | With published MW | Published MW |
|---|---|---|---|
| Under construction | 259 | 227 | 51,090 |
| Announced | 131 | 111 | 37,645 |
| Operational | 275 | 158 | 9,132 |
Compute Census AI campus census, records to 15 Nov 2026. MW summed only where a source publishes a figure. Full list: AI data center census.
Power is the part that cannot be bought on the spot market. A buyer can order servers and wait for them. A provider that has the servers and no energised hall cannot rent them out, and that is why the pipeline in our census matters to the price of an hour.
What would reverse the move
Three things would pull prices down again. More capacity could come online than demand absorbs, as it did in 2024 and 2025. A cheaper way to serve the same models could reduce the need for GPU-hours. Or a downturn in the funding of labs could release capacity back to the market. None of the three is visible in the data we hold. We list them so that a reader can recognise them if they appear, not because we predict them.
Reserved versus on-demand when prices rise
The reserved discount as a hedge
In a falling market a long commitment is a bet against yourself: you lock a rate and watch it become expensive. In a rising market the same commitment is a hedge. Our index records a reserved median for several models. For the H100 it is $3.26, a discount of −16% to the on-demand median, and for the H200 $3.40.
Hyperscaler commitments give a larger discount at longer terms. Uvik’s compilation records three-year commitments cutting H100 prices by 57 percent at AWS and 56 percent at Google Cloud and Microsoft Azure. AWS’s June 2025 announcement shows how those discounts are built: the EC2 Instance Savings Plan for P5 on a three-year term had a reduction of 45 percent from the pre-cut level, and some plans had no reduction at all.
What the discount costs you
A reserved rate is cheaper per hour, and you pay it whether you use the GPU or not. The break-even is the utilisation at which the discounted hour you pay for equals the on-demand hour you would have used. If the reserved rate is 70 percent of on-demand, you need to use the GPU more than 70 percent of the hours to come out ahead. A rising market lowers that bar a little, because the on-demand price you avoid is higher than the one you saw when you signed.
Table 4On-demand and reserved medians for the three main training and inference parts, USD per GPU-hour
| Model | Median | 12-mo reserved | Median × 730 h | Providers | |
|---|---|---|---|---|---|
| H100 | $3.90 | $3.26 | $2,847 | 11 | |
| H200 | $4.80 | $3.40 | $3,504 | 9 | |
| B200 | $6.90 | not published | $5,037 | 12 |
USD per GPU-hour, on-demand unless stated. Compute Census GPU price index of 6 Nov 2026.
For a worked version of the rent-or-reserve choice, see our guide to renting a GPU.
Capacity as well as price
A rising market also changes what you are buying. A reserved block gives you a guaranteed slot as well as a rate. The AWS Capacity Blocks page makes the point plainly by charging each block at the price in effect on the day of purchase, even if the block starts after a later update. If you expect to need capacity in three months and the price card is due to change, buying the block now locks today’s rate.
Buying hardware instead
Hardware prices and rental prices
Rental prices are not purchase prices, and the two can diverge. NVIDIA publishes no list price for the H100. The only verified figure Uvik carries is the March 2024 remark by NVIDIA’s chief executive that a Blackwell GPU would cost between $30,000 and $40,000. A purchase also needs a server, power, cooling and staff, which is a larger bill than the card.
Our purchase-price dataset records what we could verify, and our guide to the NVIDIA H100 price works through the rent-versus-buy arithmetic. For this guide the relevant point is that a rise in rental prices raises the value of owning a GPU that you can keep busy, and does nothing for a buyer who cannot.
A test for the decision
Ask three questions. Can you keep the hardware above the utilisation where ownership beats renting? Do you have, or can you buy, a place to put it that has power? And will the part still be useful when the term ends? A rental price rise changes the answer to the first question only. The other two are about the building and the chip’s age, and they have not moved because a price card did.
What to do with the trend
If you are renting by the hour
Check the price on the day you start, not the day you read the news. Prefer providers that publish a price page with a date. Expect list prices to change at short notice: the Nebius page says so in as many words. If your workload is steady, move the baseline into a reserved term and keep on-demand for bursts.
If you are signing a term
Compare the quoted rate with two numbers: the on-demand list at the same provider, and an independent index for the same tier. Ask what happens at renewal and whether the rate is fixed or reset. Ask whether the rate covers the networking and storage you need. And ask for the delivery date in writing.
If you are choosing a model
Do not choose a model because its price rose less. Choose it on memory, throughput and availability, then read the price. The H100 and the H200 do not move together day to day, as the Silicon Data analysis shows, so a favourable move in one may disappear within weeks. For the comparison of the two, our guide to H100 versus A100 shows how to price a job and not an hour.
What we will keep doing
We update the index as providers change their pages, and we date every snapshot. When a number in this guide is ours, it comes from the index and moves with it. When it is someone else’s, it carries its owner and its date, and it will not update. If you find a provider whose price we have wrong, or one we do not cover, tell us.
How to get a quote
Prices on a page are a starting point. What you pay depends on the model, the quantity, the region, the term and what else the provider needs to know about your workload. Rented capacity and purchased hardware go through different partners, and the terms are agreed for each request. We do not publish a fixed fee or a minimum order, because there is none to publish.
A request that can be answered quickly names the GPU model and the number of cards, the region or regions that are acceptable, the term and the start date, whether you need on-demand flexibility or a committed block, and the networking and storage that go with it. Add what you would do if the first choice is not available, because the second choice is often the one that ships.
If you want a view of the market before you ask, the GPU price index shows every provider quote we hold, and the methodology explains how the medians are built. When you are ready, the form on source GPUs is the way to reach us.